Unit 1.2. Freshwater Resources, Availability, Water Use And Scarcity
Instructor: Mr. Kartik Omanakuttan
In this Unit 1.2, we examine freshwater as a resource: where it is stored, how much is renewable, how it is used, and why scarcity emerges even on a planet that appears visually abundant in water. The unit builds from the hydrological foundations of Unit 1.1 and prepares the ground for the chemistry, ecology, groundwater, and irrigation units that follow.
The central message is simple but often misunderstood: freshwater availability is not only a matter of total volume. It is a matter of timing, location, accessibility, quality, infrastructure, demand, and ecological need. A river may contain water, but not at the season when farmers require it. A well may yield water, but at a salinity too high for crops. A city may have reservoirs but not enough treatment capacity. A wetland may require environmental flows even when all human sectors are competing for supply.
This unit is still primarily theoretical, but it keeps practical examples close to the concepts. The aim is to give participants a language for distinguishing between water abundance, water availability, water use, water stress, and water security.
Lecturer: Dr. Sérgio António Neves Lousada
Lecture Topic: Hydraulic Planning in Insular Urban Territories: The Case of Madeira Island — Ribeira Brava
Recorded Video: https://youtu.be/bi4IJRCTsIE
PPT File
Zoom Chat
Reading Material
1.2.1 Global Distribution of Water and Freshwater
About 71 percent of the Earth's surface is covered by water, and the oceans hold about 96.5 percent of all the Earth's water. This abundance is real, but it is not the same as freshwater availability. Most water is saline. Most freshwater is locked in glaciers, ice caps, or groundwater systems that may be deep, slow-moving, or difficult to access. The first lesson of freshwater science is therefore distribution. A large planetary volume does not imply local usability. The hydrological cycle continually renews some freshwater, but renewal varies by place and time. Tropical humid regions, snow-fed mountain basins, arid plains, coastal aquifers, and island systems all experience freshwater through different storage and renewal patterns.
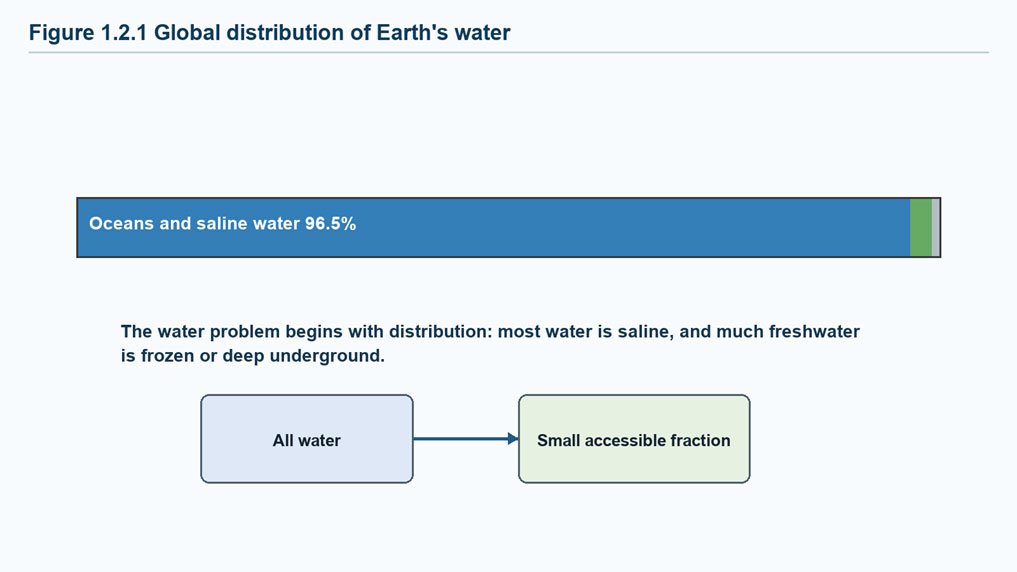
Figure 1.2.1: Global distribution of Earth's water. Source: based on USGS (n.d.) global water distribution data.
Of the world's freshwater, roughly two-thirds is stored in glaciers and ice caps, around one-third is groundwater, and only a very small fraction occurs as surface water in lakes, rivers, wetlands, and soil moisture. This is why rivers and lakes are so important despite holding a tiny share of total freshwater: they are visible, renewable, ecologically active, and accessible to human use. Groundwater deserves special attention because it is the largest store of liquid freshwater. However, groundwater availability depends on recharge, depth, water quality, pumping cost, and aquifer properties. A deep aquifer may contain large volumes but be economically or technically difficult to access. A shallow aquifer may be accessible but vulnerable to contamination and seasonal fluctuation. Glaciers and snow are also freshwater stores, but they are not reservoirs in the ordinary management sense. Their release is governed by temperature, precipitation, and seasonal melt. Communities downstream may depend on meltwater timing without directly controlling it. Climate change, therefore, alters not only the volume of stored frozen water but the timing and reliability of its release.
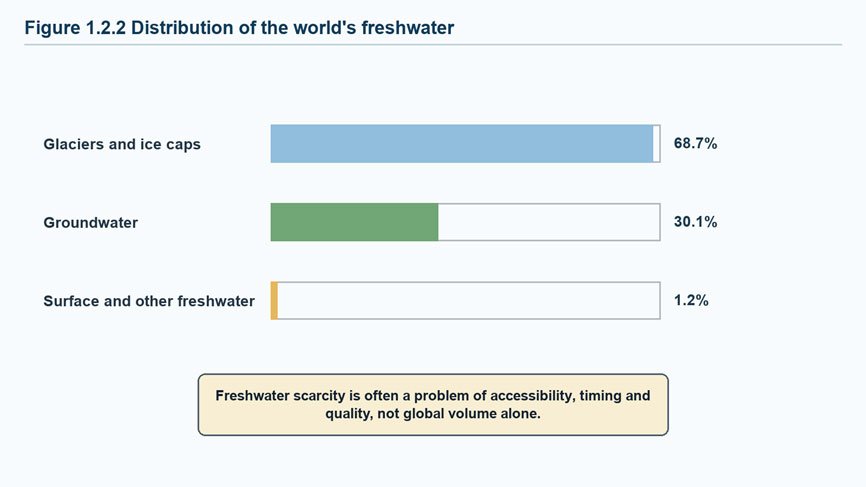
Figure 1.2.2: Distribution of the world's freshwater. Source: based on USGS (n.d.) data.
Read the Bare Fact
The most politically and economically important freshwater is not the largest store. Rivers and lakes contain a tiny fraction of global water, yet they support cities, irrigation, fisheries, industry, transport, biodiversity, and cultural life. Small stores can carry large consequences.
Task and Instructions for Participants
Before proceeding, review the following resources. While watching, distinguish three ideas: total water, renewable freshwater, and accessible water.
Essential Watch
Explanation of how much water exists on Earth. Focus on the difference between total water and accessible freshwater.
Additional Watch / Read
UN-Water facts on water availability, use, and access. Focus on the figures for water stress, withdrawals, and safe drinking water.
1.2.2 Renewable Water Availability and the Water Balance
Renewable freshwater is water that is naturally replenished through the hydrological cycle. It is often estimated through river flows and groundwater recharge, but these estimates depend on climate, land cover, storage and time period. A country with high annual rainfall may still experience dry-season scarcity. A country with low rainfall may maintain supplies through groundwater, reservoirs or imports of water-intensive goods. FAO's (2025) AQUASTAT system tracks renewable water resources, withdrawals, irrigation and water stress. The 2025 AQUASTAT Water Data Snapshot reports that renewable water availability per person has continued to decline, with a further 7 percent decrease over the preceding decade. This decline does not mean the planet has lost 7 percent of its water. It means that the relationship between renewable supply and population has tightened. A useful practical distinction is between water endowment and water security. Water endowment refers to the physical water available in rivers, aquifers, snowpack and rainfall. Water security refers to the reliable ability of people, economies and ecosystems to access water of acceptable quantity and quality at the time it is needed.
The water balance introduced in Unit 1.1 is the foundation for availability analysis. In a simplified catchment, precipitation is partitioned into evapotranspiration, runoff and storage change. If evapotranspiration increases because of higher temperature or crop expansion, less water may remain for river flow or recharge. If storage declines because groundwater is being depleted, present availability is maintained partly by reducing future availability. Renewability also has a time scale. A shallow aquifer that is recharged every monsoon behaves differently from a fossil aquifer that accumulated water under ancient climates. Both contain groundwater, but only one can be treated as renewable on human planning time scales. This distinction is critical for interpreting agricultural expansion in arid and semi-arid regions. Environmental water requirements must be included in serious availability analysis. A river's entire flow is not available for human withdrawal. Some water must remain to sustain sediment transport, fish migration, floodplain wetlands, water quality dilution, channel maintenance and cultural uses. Ignoring ecological requirements creates an inflated estimate of usable supply.
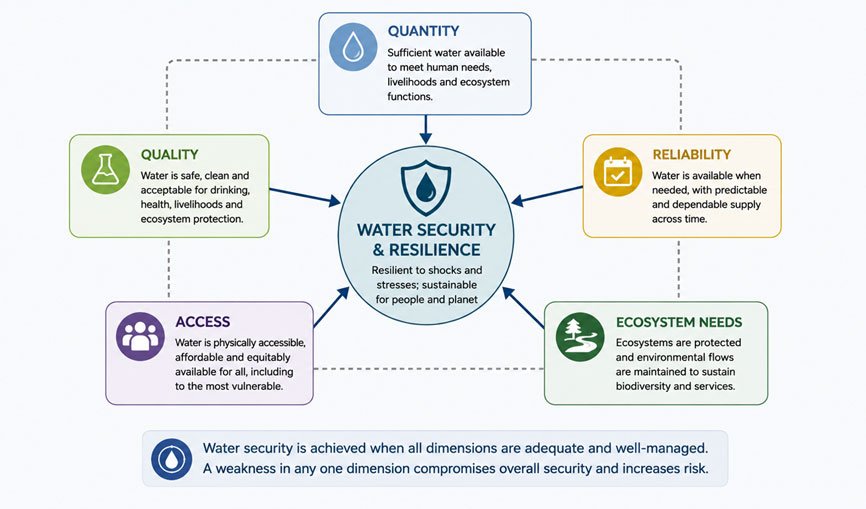
Figure 1.2.3: A practical lens for water security assessment. Source: Kartik Omanakuttan
1.2.3 Water Use by Sector and the Difference Between Withdrawal and Consumption
Water withdrawal is the volume of water taken from a river, lake, reservoir, or aquifer. Water consumption is the portion not returned to the same system in usable form because it evaporates, is transpired by crops, is incorporated into products, or returns far downstream or at degraded quality. This distinction is essential. A hydropower plant may withdraw large volumes but return most of the water to the river. Irrigated agriculture may withdraw less than a large cooling system in some settings, but much of the applied water is consumed through evapotranspiration. Globally, agriculture is the dominant water-withdrawing sector. UN-Water (2025) facts sheet reports that 72 percent of freshwater withdrawals are used by agriculture, 16 percent by industries and 12 percent by municipalities, citing FAO data. These global figures hide regional variation, but they explain why food systems are central to any discussion of freshwater stress.
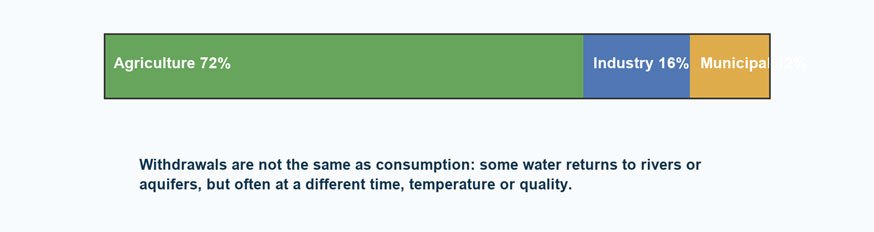
Figure 1.2.4: Approximate global freshwater withdrawals by sector. Source: based on UN-Water (2025) and FAO data
Municipal water use is often politically visible because it is experienced directly through taps, tankers, and household bills. Agricultural water use is often less visible because it is embedded in food production and rural economies. Industrial water use varies widely by sector, with energy, mining, manufacturing, and processing all creating distinct quantity and quality pressures. It is also important to distinguish blue, green, and grey water. Blue water is liquid freshwater in rivers, lakes, reservoirs, and aquifers. Green water is soil moisture used by plants. Grey water is a water-quality concept: the volume of water needed to assimilate pollution to an acceptable standard. These categories help participants understand why rainfed agriculture, irrigated agriculture, and pollution control all belong in freshwater resource analysis.
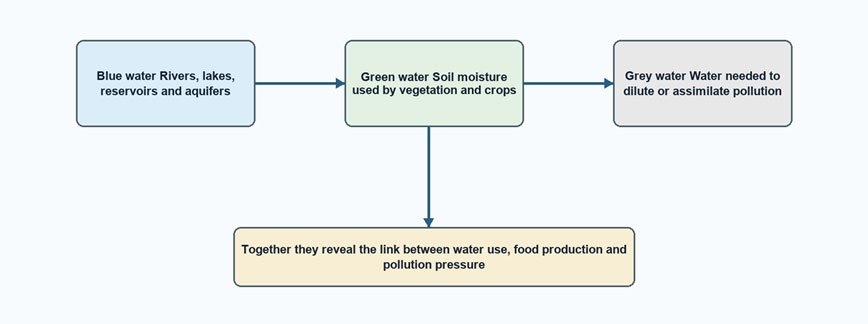
Figure 1.2.5: Blue, green, and grey water in freshwater resource analysis. Source: Kartik Omanakuttan
Water-use statistics require careful interpretation. A sector may withdraw less water but cause severe local impacts because it withdraws during low-flow periods or returns water in polluted form. Another sector may withdraw large volumes but return most of them quickly. Therefore, a good water-use assessment asks: how much is withdrawn, how much is consumed, what quality returns, where it returns, and when it returns. Virtual water and water footprints extend this reasoning to trade. A water-scarce region may import grain, effectively importing the water used to produce it elsewhere. This can reduce local pressure but may transfer water demand to another basin. The concept is useful, but it should be used carefully: not all litres of water have the same scarcity value, ecological value, or opportunity cost.
1.2.4 Water Stress, Water Scarcity, and Seasonal Mismatch
Water scarcity is commonly used as a general term, but water science requires more precision. Physical scarcity occurs when available renewable water is insufficient to meet demand. Economic scarcity occurs when water exists physically, but infrastructure, institutions, or affordability prevent access. Seasonal scarcity occurs when water is available during one part of the year but not when demand peaks. Quality scarcity occurs when water exists but is too polluted, saline, or unsafe for intended use. SDG indicator 6.4.2 defines water stress as freshwater withdrawal by all economic activities compared with total renewable freshwater resources, after accounting for environmental water requirements. UN-Water's (2024) progress update explains that a territory is considered water-stressed when it withdraws 25 percent or more of its renewable freshwater resources.
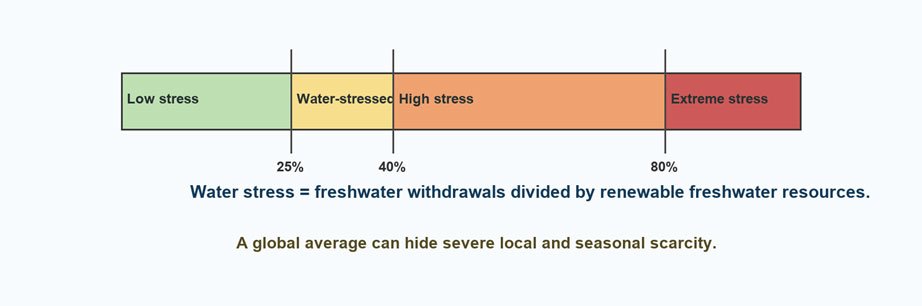
Figure 1.2.6: Water stress thresholds used in SDG 6.4.2. Source: based on UN-Water (2024)
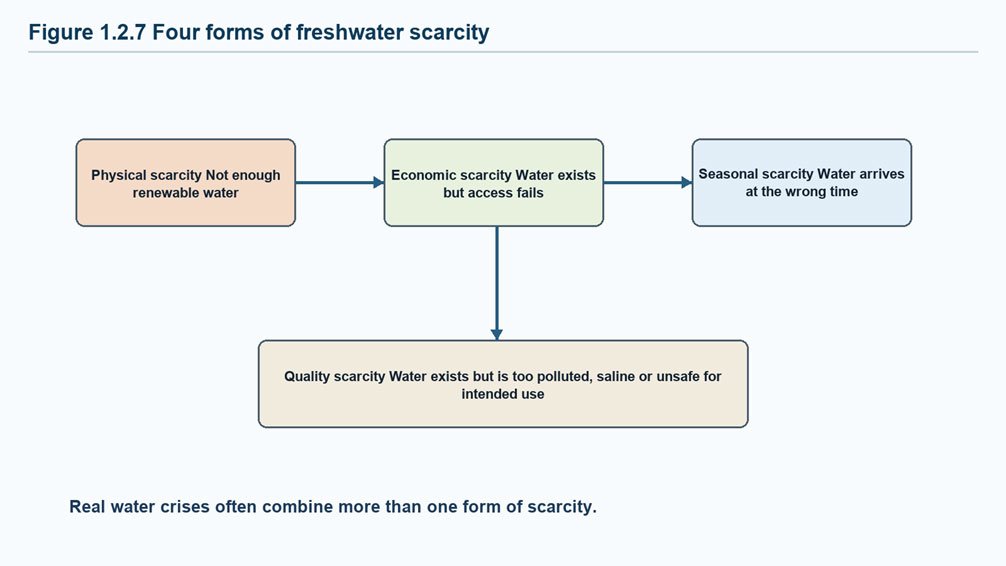
Figure 1.2.7: Four forms of freshwater scarcity. Source: Kartik Omanakuttan
Global averages can be misleading. UN-Water (2025) reports that at the global level total withdrawals may appear below the stress threshold, but that average hides severe stress in particular regions, including Northern Africa, Central and Southern Asia, and Western Asia. WRI's Aqueduct analysis similarly reports that 25 countries, containing roughly one-quarter of the global population, face extremely high water stress each year (Kuzma et al., 2023). Seasonality is one of the most common reasons for misunderstanding water scarcity. A basin may receive enough annual rainfall but still experience months of scarcity. This is common in monsoon climates where rainfall is concentrated in a short-wet season. Without adequate storage, recharge, soil moisture retention, and demand management, wet-season abundance does not automatically become dry-season availability.
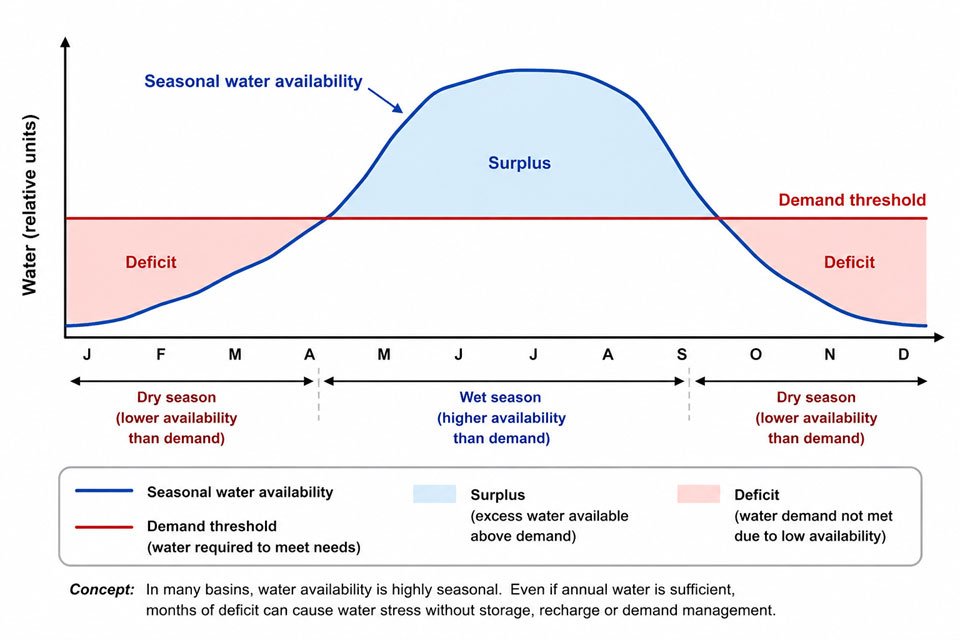
Figure 1.2.8: Seasonal mismatch between water availability and demand. Source: Kartik Omanakuttan
Practical Example - Seasonal Monsoon Regions
Many monsoon regions receive a large share of annual rainfall in a short season. Annual water availability may appear adequate, yet dry-season cities and farms can face acute stress. This is not a contradiction. It is a storage and timing problem. Reservoirs, tanks, wetlands, floodplains, soil moisture, and aquifers become crucial because they transform seasonal abundance into dry-season availability. A monsoon basin can therefore face both flood and scarcity within the same year. The flood is not proof of abundance, and the dry-season scarcity is not proof of permanent aridity. Both are expressions of timing, storage, and demand. This is why water planning in seasonal climates must treat flood management, groundwater recharge, and dry-season allocation as connected issues.
1.2.5 Drivers of Increasing Scarcity
Freshwater scarcity is shaped by both supply and demand. On the supply side, climate variability, glacier retreat, groundwater depletion, land degradation, and water pollution can reduce reliable usable water. On the demand side, population growth, urbanization, irrigated agriculture, industrialization, energy production, and changing diets increase pressure. The WMO State of Global Water Resources 2024 report notes that only one-third of river basins had normal hydrological conditions in 2024 and that all glacier regions reported losses for the third consecutive year. Such findings matter because water planning often assumes that past variability is a reliable guide to future risk. Increasing extremes weaken that assumption.
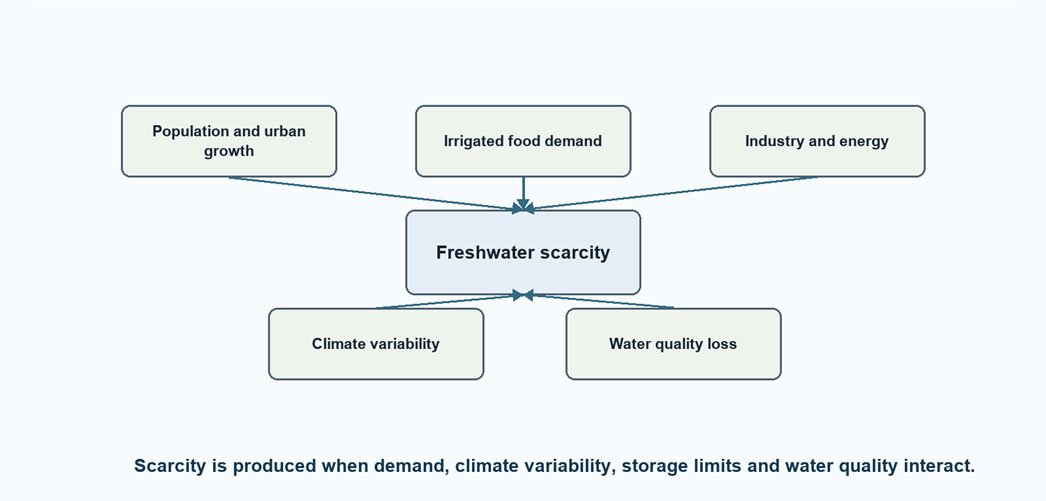
Figure 1.2.9: Drivers that convert limited availability into scarcity. Source: based on FAO, UN-Water (2025), WMO and WRI syntheses
Water quality also reduces availability. A polluted river may still contain water, but that water may be unusable without costly treatment. Saline groundwater, nitrate-contaminated wells, pathogen-polluted streams, and chemically contaminated reservoirs all show that availability is partly a quality question. This is why Unit 1.3 turns from volume to chemistry and pollution. Infrastructure can both reduce and create scarcity. Reservoirs, canals, pumps, and treatment plants can make water available where and when it is needed. But they can also encourage expansion of demand, alter ecological flows, increase evaporation, create maintenance burdens, or lock regions into water-intensive development pathways. Unit 1.6 returns to this problem through irrigation. Social and economic factors shape demand. Rising incomes can change diets toward more water-intensive foods. Urban growth concentrates demand and wastewater. Energy systems require water for cooling, extraction, or hydropower. Industrial growth can create both quantity demand and pollution pressure. Scarcity is therefore not a purely natural condition; it is produced through the interaction of hydrology and development choices.
1.2.6 Water Availability and Scarcity
Read the global incidents showcasing why water scarcity occurs. Cape Town's 2017-2018 water crisis showed that urban scarcity can emerge when reservoirs, demand patterns, and rainfall deficits interact. The crisis was not simply a drought story. It was a story about how close a city can come to system failure when supply buffers shrink, and demand management becomes urgent. In regions such as northwestern India, Iran, the Arabian Peninsula, and the U.S. High Plains, food production has been expanded through groundwater pumping. This increases present water availability but can reduce future availability if withdrawals exceed recharge. Unit 1.5 develops this issue in detail. Glaciers can buffer seasonal flows, releasing meltwater during warm and dry periods. Glacier retreat may initially increase meltwater but later reduce the reliability of dry-season flows. This illustrates why climate change affects not only total water but also the timing of water. Coastal towns may appear to have groundwater, but over-pumping can draw the freshwater-saltwater interface inland. The result is quality scarcity: the aquifer still contains water, but it is too saline for drinking or irrigation without treatment. Such cases show why availability cannot be assessed through volume alone.
Indicators Used to Describe Scarcity
Several indicators are used to describe freshwater scarcity, and each has strengths and limitations. Per-capita renewable water availability divides national renewable water resources by population. It is simple and useful for comparison, but it hides internal inequality, seasonal variation, water quality, and basin-level stress. A country can appear water secure in national averages, while some basins face severe stress.
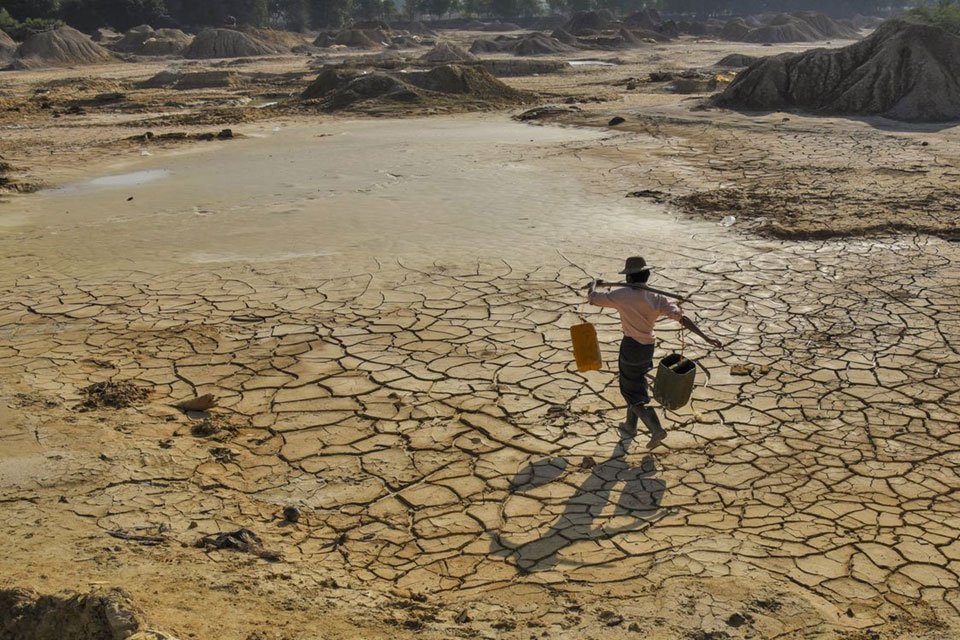
Figure 1.2.10: Impact of water scarcity. Source: Pexels
The Falkenmark indicator, widely used in water literature, classifies countries according to annual renewable water availability per person (Falkenmark et al., 1989; Damkjaer and Taylor, 2017). Its value is pedagogical because it shows how population growth changes pressure on a fixed renewable resource. Its limitation is that it treats water as a national average and does not directly include infrastructure, economic access, or environmental flow requirements. Water stress indicators, including SDG 6.4.2, compare withdrawals with available renewable resources. These are more directly connected to the use of pressure. However, they still require careful interpretation. A basin may have low annual stress but very high dry-season stress. A withdrawal may return to the river, but at a different quality. A high-stress basin may be economically resilient if it has strong institutions and efficiency; a lower-stress basin may still experience a crisis if infrastructure fails. Water poverty and water security indices attempt to include access, capacity, environment, and use. They are useful for policy comparison, but can become too aggregated. The more dimensions included, the more the final score may hide the specific cause of scarcity. For practitioners, the most useful approach is often to use indicators as entry points, then return to field evidence.
Participants should therefore avoid treating any single index as a final diagnosis. A good scarcity assessment triangulates physical data, sectoral withdrawals, seasonal patterns, quality conditions, infrastructure reliability, ecological requirements and lived experience.
Demand Scenarios and the Problem of Future Availability
Freshwater planning cannot rely only on present demand. A basin that appears balanced today may become stressed if population grows, irrigation expands, industry relocates, or climate variability increases. Scenario thinking is therefore an essential part of water availability assessment. It asks not only what the current balance is, but how that balance changes under plausible futures. A simple scenario exercise can begin with three questions. What happens if rainfall remains similar but demand increases? What happens if demand remains similar but dry-season flows decline? What happens if both demand rises and quality deteriorates? These questions help participants see why water security is a moving target rather than a fixed condition. Demand projections should also account for behavioural and economic responses. When water becomes scarce, users may conserve, shift crops, drill deeper wells, purchase water, migrate, invest in treatment, or lobby for new infrastructure. These responses change the water system. Some reduce pressure; others transfer pressure to aquifers, downstream users or ecosystems. For this reason, the most honest availability assessment states its assumptions clearly. It identifies the climate period used, the demand sectors included, the environmental flow requirement assumed, the treatment capacity available, and the uncertainty around groundwater recharge. Without these assumptions, a water availability number can appear more precise than it really is.
1.2.7 Case Studies in Freshwater Availability and Scarcity
Case Study 1.2-A - Cape Town and the Politics of Day Zero
Few modern cities have demonstrated the complexity of water scarcity as vividly as Cape Town, South Africa. Between 2015 and 2018, the city experienced a prolonged drought that pushed its water supply system to the brink of failure. The crisis became internationally known through the phrase “Day Zero”—the projected date when water levels in the city's major reservoirs would fall so low that most municipal taps would be shut off and residents would be required to collect rationed water from public distribution points. At the height of the crisis, a city of approximately four million people was confronted with the possibility that one of the most basic urban services could cease functioning.
The immediate trigger was a sequence of exceptionally dry years that drastically reduced inflows into the six major reservoirs supplying the metropolitan area. Yet drought alone cannot explain why the crisis became so severe. Hydrologically, Cape Town depended heavily on surface reservoirs, making the city vulnerable to rainfall variability. Population growth increased demand, while long-term investment in alternative supplies, such as desalination, wastewater reuse, and groundwater development, had lagged behind growing needs. As later analyses observed, the crisis emerged not simply from a lack of rain but from the interaction of climate variability, infrastructure dependence, governance choices, and patterns of water consumption.
The phrase “Day Zero” itself became a powerful governance tool. It transformed a technical problem of reservoir storage into a public narrative that residents could understand. Daily announcements tracked dam levels. Households were given strict consumption targets. Public campaigns encouraged shorter showers, greywater reuse, and behavioural change. Water restrictions eventually reduced consumption dramatically, demonstrating that urban demand is not fixed but responsive to policy, pricing, and communication. Cape Town ultimately avoided Day Zero through a combination of demand reduction, emergency supply measures, and the arrival of seasonal rainfall.
However, the crisis also revealed profound inequalities. While all residents were asked to conserve water, not all residents faced the same risks. Wealthier households could install rainwater tanks, drill private boreholes, purchase bottled water, or invest in household treatment systems. Many low-income communities already consumed relatively little water before the crisis and therefore had less capacity to reduce usage further. Research conducted after the drought found that wealthier households reduced municipal consumption more substantially, partly because they had access to alternative sources. One study observed that before the drought, richer households consumed approximately twice as much piped water as poorer households, but during the crisis, their municipal consumption fell below that of poorer residents because they shifted to privately secured supplies.
This uneven capacity to adapt raises a central question in water governance: when scarcity occurs, who bears the burden of adjustment? Scholars examining the crisis argued that Cape Town’s water emergency reflected not only drought but also deeper contradictions in water governance and infrastructure planning. As Millington and colleagues observed, the city's scarcity crisis emerged through the interaction of climate stress with existing inequalities and governance arrangements. Several memorable statements emerged during the crisis. One of the most frequently repeated descriptions defined Day Zero as the moment when “the taps are turned off.” This simple phrase captured public attention worldwide because it translated a complex hydrological and institutional problem into a tangible reality. Brookings (2021) later described Cape Town as having come “to the brink of Day Zero”, demonstrating how close a major city had come to exhausting its conventional water supply.
The Cape Town case demonstrates that water scarcity is rarely a purely hydrological phenomenon. Reservoir levels matter, but so do governance systems, infrastructure investments, demand management, public trust, communication strategies, and social inequality. A city can experience severe scarcity not only because rainfall declines, but because institutions fail to anticipate and adapt to changing conditions. Conversely, the successful postponement and eventual avoidance of Day Zero illustrate that scarcity outcomes can be altered through collective action, political commitment, and behavioural change.
Cape Town's water crisis became internationally known through the phrase Day Zero, the projected date when municipal taps would be turned off, and residents would collect rationed water from distribution points. The crisis emerged from a sequence of low-rainfall years, high dependence on surface reservoirs, population growth, uneven demand patterns, and the difficulty of reducing consumption quickly enough (Simpson et al., 2019; Brookings, 2021). The scientific lesson is that a reservoir system is a storage buffer, not a permanent guarantee. When inflows decline, and demand remains high, stored water can fall rapidly. The administrative lesson is that demand management must begin before emergency thresholds are reached. The social lesson is that scarcity is experienced unevenly: wealthy households can buy tanks, boreholes, or bottled water more easily than low-income households. This case is useful here, as it shows how physical, economic, and behavioural factors converge. Rainfall deficits mattered. So did infrastructure, urban growth, public communication, household behaviour, and inequality. A purely meteorological explanation would be incomplete.
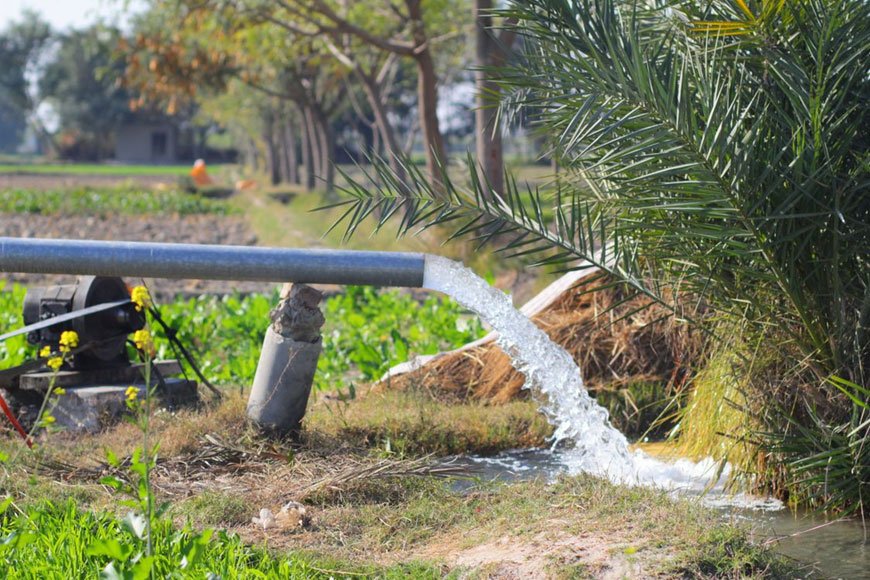
Figure 1.2.11: Groundwater for irrigation. Source: Pexels
Case Study 1.2-B - Groundwater and Food Production in Semi-Arid Regions
In many semi-arid agricultural regions, groundwater has converted water-scarce landscapes into productive farming zones. Tube wells, pumps, and subsidised energy allow farmers to irrigate crops even where rainfall is unreliable. At first, groundwater appears to solve scarcity by providing a dependable buffer. The difficulty is that the buffer can be depleted. If groundwater extraction exceeds recharge, water tables fall. Farmers respond by deepening wells and installing stronger pumps. This maintains production for some years but increases costs and excludes poorer farmers. The region remains productive, but the productivity is partly financed by drawing down stored water. This following case clarifies the difference between present availability and sustainable availability. A resource can be available today precisely because future availability is being reduced. Unit 1.5 will return to this issue in detail through groundwater governance and depletion.
Case Study 1.2-B: Groundwater and Food Production in Semi-Arid Regions — The Groundwater Revolution in India
Across large parts of semi-arid India, groundwater transformed the relationship between agriculture and water scarcity. Regions that once depended almost entirely on uncertain monsoon rainfall became major centres of food production through the expansion of tube wells, electric pumps, and groundwater irrigation. States such as Punjab, Haryana, Rajasthan, Gujarat, and parts of peninsular India experienced what many scholars have described as a groundwater revolution. Farmers gained access to a relatively reliable source of water independent of seasonal rainfall, allowing them to cultivate water-intensive crops and increase agricultural productivity dramatically.
The benefits were substantial. Groundwater irrigation helped support the Green Revolution, increased crop yields, reduced vulnerability to short-term drought, and contributed significantly to national food security. Unlike large surface irrigation systems, groundwater could be accessed directly by individual farmers, providing flexibility and reliability. As FAO has observed, groundwater is particularly valuable because it furnishes a dependable source of irrigation water even when surface supplies fluctuate. Yet the apparent solution to scarcity contained the seeds of a new scarcity. In many regions, groundwater extraction gradually exceeded natural recharge. Water tables began to decline. Farmers responded by drilling deeper wells and installing more powerful pumps. Initially, this strategy appeared successful because production continued. The declining aquifer remained largely invisible, hidden beneath the surface. Fields remained green, harvests remained high, and rural economies continued to function. Over time, however, the costs of adaptation increased. As groundwater levels fell, pumping required more energy and more capital. Wells that once supplied water from shallow depths became unusable. Farmers with access to credit could deepen wells and invest in stronger pumps. Smaller farmers often could not. The result was a gradual differentiation of agricultural opportunity. Those with capital-maintained access to groundwater; those without capital faced increasing risks and costs.
Research from India has shown that groundwater depletion is associated with measurable declines in agricultural production. Falling water tables reduce crop yields, cultivated area, and overall agricultural output in groundwater-dependent regions. The implications extend beyond agriculture. As groundwater becomes more expensive to access, rural livelihoods become more precarious, and inequalities within farming communities can widen. The governance challenge is particularly difficult because groundwater simultaneously supports food security and threatens long-term sustainability. Recent analyses highlight a profound policy dilemma. If groundwater overdraft were halted immediately in major agricultural regions, production of staple crops such as rice and wheat would decline significantly, increasing food prices and potentially placing millions more people at risk of hunger. One recent assessment estimated that eliminating groundwater depletion without broader agricultural adjustments could increase global rice prices by approximately 7.4% and wheat prices by 6.7%, potentially increasing the number of people vulnerable to hunger by about 24 million.
This creates a tension between present and future availability. Water that appears available today may be available precisely because stored groundwater accumulated over centuries or millennia is being consumed. Current agricultural productivity may therefore depend partly on the depletion of future water reserves.
The Indian groundwater experience illustrates a fundamental concept in water science and governance: availability is not the same as sustainability. A resource can be physically available, economically valuable, and socially beneficial in the short term while simultaneously becoming less available for future generations. The case also demonstrates why scarcity must be understood dynamically. Scarcity is not simply the absence of water. It can emerge when demand grows faster than recharge, when institutions fail to regulate extraction, or when technological advances allow users to consume groundwater faster than natural systems can replenish it.
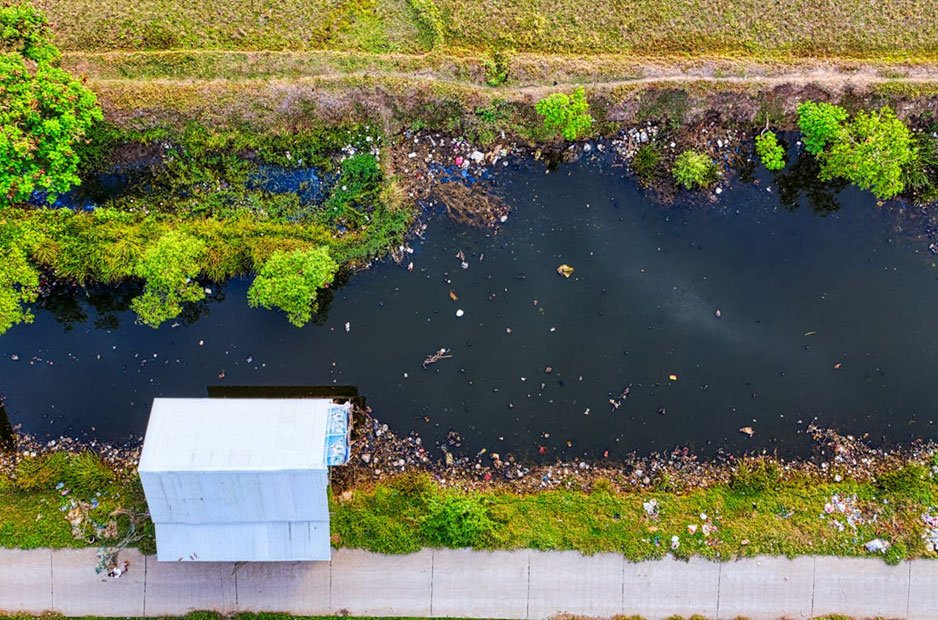
Figure 1.2.12: A polluted river basin in Indonesia. Source: Pexels
Case Study 1.2-C - Environmental Flows and the Meaning of Available Water
A river basin may appear to have surplus water if assessment is based only on human withdrawals and average annual flow. The picture changes when environmental flows are included. Fish migration, sediment movement, floodplain recharge, wetland productivity, water temperature and dilution of pollutants all require water to remain in the river at particular times (Brisbane Declaration, 2007; Arthington et al., 2018). Environmental flow science does not claim that rivers must remain untouched. Rather, it asks how much alteration a river system can absorb before its ecological functions decline. The answer is rarely a single minimum flow. Many rivers need seasonal variability: high flows to connect floodplains, moderate flows to maintain channel form, and low flows that still support refuge habitats.
Case Study 1.2-C: Environmental Flows and the Meaning of Available Water — The Murray–Darling Basin, Australia
One of the most influential examples of environmental flow management comes from the Murray–Darling Basin (MDB) in Australia, a river system covering more than one million square kilometres and supporting approximately 40% of Australia's agricultural production. For much of the twentieth century, water management in the basin was guided primarily by a development paradigm: rivers were viewed as resources to be stored, diverted, and allocated for irrigation, towns, and industry. Water that flowed to wetlands, floodplains, estuaries, and downstream ecosystems was often regarded as water that had not been "used".
By the late twentieth century, however, signs of ecological stress had become increasingly difficult to ignore. Reduced river flows, extensive water extraction, salinization, declining water quality, shrinking wetlands, fish population declines, and the deterioration of floodplain forests revealed that rivers could not continue to function ecologically if almost all available water was allocated to human use. The landscape of the Murray–Darling Basin was described as being under "severe ecological stress," with many water-dependent ecosystems showing signs of degradation.
The scientific challenge was not simply to determine how much water people required. It was to determine how much water rivers themselves required. This question gave rise to the concept of environmental flows, now defined as the quantity, timing, frequency, duration, and quality of water flows necessary to sustain freshwater ecosystems and the human livelihoods that depend upon them. The widely cited Brisbane Declaration (2007) emphasises that environmental flows are not water left over after human use; rather, they are a fundamental component of sustainable water management. As the Declaration states, environmental flows describe "the quantity, timing, and quality of water flows required to sustain freshwater and estuarine ecosystems and the human livelihoods and well-being that depend on them." In the Murray–Darling Basin, this seemingly simple idea proved politically transformative. Once environmental requirements were recognised, it became apparent that much of the basin's water had already been over-allocated. Water that had previously been counted as available for irrigation was now understood to be necessary for maintaining ecological processes. More than 30,000 wetlands, including numerous internationally significant Ramsar sites, depend upon periodic inundation. Native fish species require flow variability for migration and reproduction. Floodplain forests require seasonal flooding to survive. Waterbirds depend on flood pulses that create breeding habitat. These ecological functions cannot be maintained through a single minimum flow threshold; they depend on a pattern of seasonal variability that resembles, at least partially, the river's natural hydrological regime.
The consequences of ignoring environmental flows became especially visible during Australia's Millennium Drought (approximately 2001–2009). As river flows declined and water demands remained high, competition intensified among irrigators, urban users, governments, and environmental agencies. The drought demonstrated that rivers are not merely conveyance channels for water delivery; they are living systems whose ecological resilience can be lost if flow regimes are excessively altered. This recognition led to major reforms, including government programmes to recover water for environmental purposes through water buybacks, efficiency improvements, and revised basin planning. Significant volumes of water were subsequently allocated specifically for environmental outcomes.
Yet these reforms also exposed difficult governance questions. Every litre returned to the river for environmental purposes was a litre unavailable for irrigation. Farming communities frequently argued that environmental water recovery threatened agricultural production, employment, and regional economies. Environmental advocates countered that without healthy rivers, there would be no long-term agricultural future to protect. The resulting debates illustrate a central challenge in water governance: environmental flows are not merely scientific recommendations; they are allocation decisions that redistribute benefits and costs among different users. Recent controversies continue to demonstrate the political sensitivity of environmental flows. In some instances, environmental water deliveries have been delayed or reduced because of competing agricultural priorities, despite concerns that postponement could damage wetlands and disrupt breeding cycles of fish, birds, and amphibians. One internal communication cited in recent reporting acknowledged that delaying environmental releases was "at the detriment of the environment".
The Murray–Darling experience fundamentally changed how water availability is understood. Traditionally, water availability was calculated by estimating river flows and subtracting existing withdrawals. Environmental flow science introduced a different perspective: a substantial portion of river flow may not be available for allocation because ecological systems depend upon it. Consequently, scarcity often becomes visible much earlier than conventional accounting suggests. The practical significance of this insight extends far beyond Australia. Around the world, rivers are increasingly expected to satisfy agriculture, cities, hydropower generation, industry, navigation, recreation, biodiversity conservation, and climate adaptation simultaneously. Environmental flow assessments provide a mechanism for translating ecological requirements into operational decisions concerning reservoirs, licences, irrigation systems, and drought management. They transform ecological knowledge into planning criteria.
For water managers and administrators, the Murray–Darling case demonstrates that environmental flows are not an environmental luxury to be considered after development objectives have been met. Rather, they redefine the meaning of available water itself. A river basin that appears water-rich under conventional accounting may already be water-scarce once environmental requirements are recognised. The critical question is therefore not simply how much water exists, but how much can be withdrawn without undermining the ecological systems that make future water availability possible.
This case is important for Unit 1.2 because it changes the definition of availability. If all river water is counted as available for withdrawal, scarcity appears later than it actually should. If environmental requirements are recognised, scarcity becomes visible earlier, and water allocation must be negotiated before ecological collapse occurs. For administrators and practitioners, environmental flows also provide a bridge between science and planning. They translate ecological needs into flow regimes that can be considered in reservoir operation, licensing, irrigation planning, and drought management.
Mandatory Quiz: [Click Here]
1.2.8 Wrap Up Unit 1.2
Please post a short synthesis in Forum W-001 under the tag "Unit 1.2 Reflection". Your response should identify one freshwater resource in your region and describe its availability in terms of quantity, timing, quality, and demand.
Closing Note
Freshwater scarcity is rarely explained by one number. It is a relationship between moving water, stored water, used water, polluted water, and needed water. To understand scarcity well, we must ask not only how much water exists, but when it arrives, where it is stored, who uses it, and whether it remains fit for life.
References
FAO (2025). Renewable water availability per person plunges 7 percent in a decade as global
scarcity deepens, FAO data shows. https://www.fao.org/newsroom/detail/renewable-water-availability-per-person-plunges-7-percent-in-a-decade-as-global-scarcity-deepens--fao-data-shows/
USGS Water Science School (n.d.). How Much Water is There on Earth?
https://www.usgs.gov/water-science-school/science/how-much-water-there-earth
UN-Water (2024). Progress on Level of Water Stress - 2024 Update.
https://www.unwater.org/publications/progress-level-water-stress-2024-update
Kuzma, S., Saccoccia, L., & Chertock, M. (2023). 25 Countries, Housing One-Quarter of the
Population, Face Extremely High Water Stress. World Resources Institute. https://www.wri.org/insights/highest-water-stressed-countries
WMO State of Global Water Resources 2024.
Damkjaer, S., & Taylor, R. (2017). The measurement of water scarcity: Defining a meaningful
indicator. Ambio, 46, 513-531. https://pmc.ncbi.nlm.nih.gov/articles/PMC5547033/
Brookings (2021). Cape Town: Lessons from managing water scarcity.
https://www.brookings.edu/articles/cape-town-lessons-from-managing-water-scarcity/
Simpson, N. P., Shearing, C. D., & Dupont, B. (2019). The Cape Town drought: A study of the
combined effectiveness of measures implemented to prevent Day Zero. Environmental and Resource Economics discussion summary. https://www.efdinitiative.org/publications/cape-town-drought-study-combined-effectiveness-measures-implemented-prevent-day-zero
Arthington, A. H., Bhaduri, A., Bunn, S. E., Jackson, S. E., Tharme, R. E., Tickner, D., Young,
B., Acreman, M., Baker, N., Capon, S., Horne, A. C., Kendy, E., McClain, M. E., Poff, N. L., Richter, B. D., & Ward, S. (2018). The Brisbane Declaration and Global Action Agenda on Environmental Flows. Frontiers in Environmental Science, 6, 45. https://www.frontiersin.org/journals/environmental-science/articles/10.3389/fenvs.2018.00045/full
Brisbane Declaration (2007). Environmental Flows are Essential for Freshwater Ecosystem Health
and Human Well-Being. https://www.conservationgateway.org/ConservationPractices/Freshwater/EnvironmentalFlows/MethodsandTools/ELOHA/Documents/Brisbane-Declaration-English.pdf
Falkenmark, M., Lundqvist, J., & Widstrand, C. (1989, November). Macro‐scale water scarcity
requires micro‐scale approaches: Aspects of vulnerability in semi‐arid development. In Natural resources forum (Vol. 13, No. 4, pp. 258-267). Oxford, UK: Blackwell Publishing Ltd. https://doi.org/10.1111/j.1477-8947.1989.tb00348.x
UN-Water (2025). Water Facts, January 2025.
https://www.unwater.org/sites/default/files/2025-01/UN-Water_Water_Facts_one_pager_January_2025.pdf