Unit 1.4: Water Biology & Ecology
Instructor: Mr. Kartik Omanakuttan
In this Unit 1.4, we examine the historical transformation and contemporary governance of aquatic ecosystems, with specific attention to how freshwater and marine biological systems are degraded, enclosed, fragmented, and unevenly appropriated under modern development trajectories. This unit situates water biology within political ecology, environmental governance, and socio-economic dependency, moving beyond ecological description to understand who benefits, who bears the cost, and how biological degradation becomes socially stratified.
Recorded Video: https://youtu.be/Sxxe5H6lZ8M
PPT File
1.4.1 Understanding Aquatic Ecosystem Degradation
What is Aquatic Ecosystem Degradation?
Aquatic ecosystems are living systems. A river is not simply a channel of moving water. It is a community of organisms, a set of physical and chemical processes, a provider of services to millions of people, and an entity with its own biological integrity. When we speak of aquatic ecosystem degradation, we mean the progressive loss of that integrity — the weakening and eventual collapse of the biological structures, ecological processes, and functional relationships that make an aquatic system capable of sustaining life and delivering benefits to people.
More formally, aquatic ecosystem degradation refers to the sustained alteration of the biotic structure and ecosystem processes of freshwater and marine systems as a result of human pressures. These pressures include nutrient enrichment (eutrophication), chemical and biological contamination, hydrological modification (dams, diversions, drainage), habitat loss, invasive species introduction, and the thermal and chemical stress imposed by a changing climate. Crucially, degradation is not a single event. It is cumulative and often path-dependent, meaning that each incremental stress compounds the effects of previous stresses, making recovery progressively more difficult.
To understand degradation in systems terms, consider a lake receiving increasing loads of nutrients, primarily nitrogen and phosphorus from agricultural runoff. At low nutrient levels, the lake supports diverse plant communities (macrophytes) rooted in clear, oxygen-rich water. As nutrient concentrations rise, conditions begin to favour fast-growing microscopic algae (phytoplankton) over slower-growing macrophytes. The algae cloud the water, shading the bottom plants. When algal cells die and sink, bacteria decompose them, consuming dissolved oxygen in the process. The lake begins to lose the oxygen that fish and invertebrates depend upon. At some point, the system crosses an ecological threshold and flips into a new state: turbid, oxygen-depleted, dominated by algal blooms, with dramatically reduced biodiversity. This transition between ecological states, what scientists call a shift to an "alternative stable state", is difficult to reverse even when nutrient inputs are subsequently reduced, because feedback mechanisms within the degraded system tend to maintain the turbid condition.
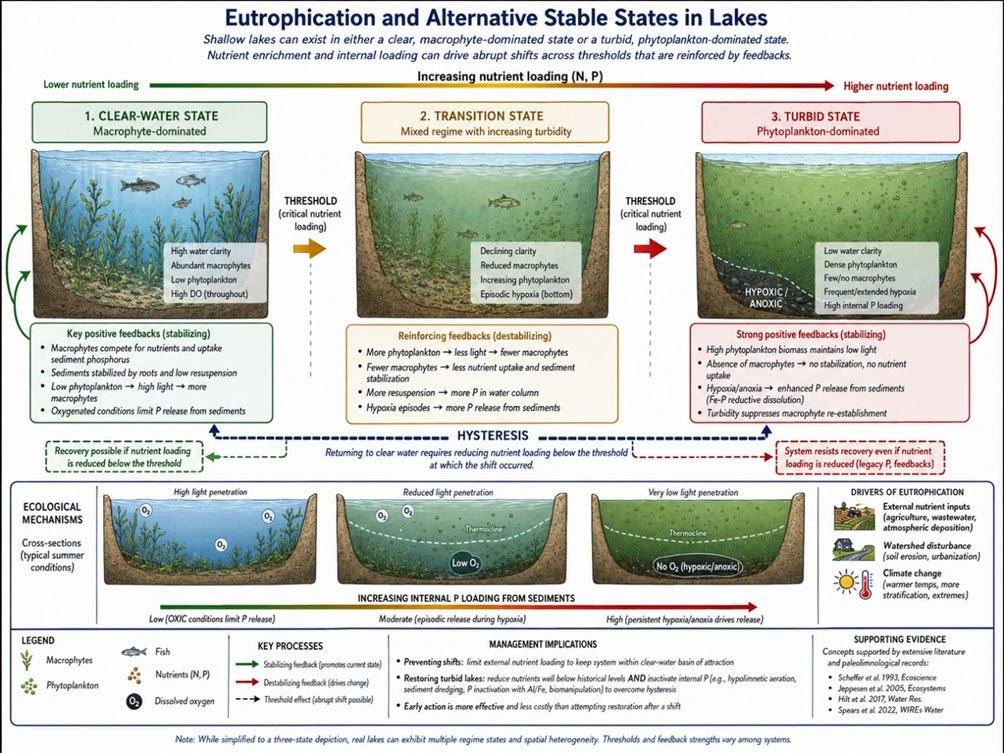
Figure 1.4.1: Eutrophication and alternative stable states in a lake system showing the progression from a clear-water, macrophyte-dominated state, through nutrient enrichment, to a turbid, phytoplankton-dominated state with hypoxic conditions (Based on Scheffer et al. 1993, Jeppesen et al. 2005, Spears et al. 2022). Source: Kartik Omanakuttan, 2026
One of the most important analytical frameworks for understanding aquatic degradation comes from the Millennium Ecosystem Assessment (2005), which defines degradation not merely as physical damage to a water body, but as the reduction in the capacity of that system to deliver services, regulating services such as flood buffering and water purification, provisioning services such as fish and freshwater, and cultural services such as recreation and spiritual value. This distinction matters enormously because a lake may still exist, hold water, and appear blue in a photograph, while its biological integrity and ecosystem functioning have been severely compromised. The water body persists; the ecosystem, in a meaningful sense, does not.
A critical feature of aquatic degradation that makes it politically difficult to address is what we might call its invisibility in time. Unlike a factory fire or a flood, aquatic degradation typically proceeds below the surface, species by species, function by function. Dissolved oxygen concentrations decline. A fish species disappears from an estuary. The drinking water begins to taste different. These signals are real, but they are diffuse and gradual, and they rarely trigger institutional response until a visible crisis, such as a mass fish kill, a drinking water failure, a toxic algal bloom, etc., suddenly makes years of accumulated damage impossible to ignore.
Read the Bare Fact
Let us be direct about something that is often obscured in technical discussions of water quality. Aquatic ecosystems do not degrade because nature is fragile. They degrade because powerful economic actors (industrial agriculture, urban developers, hydropower companies, mining firms) are permitted to externalise the costs of their activities onto shared water resources, while weaker actors (subsistence fishers, rural water users, indigenous communities, future generations) absorb those costs without compensation. The legal frameworks that govern water in most countries were designed to facilitate economic use, not to protect ecological function. The result is a system in which degradation is, quite literally, the policy.
Task and Instructions for Participants
All participants are advised to carefully watch and listen to the following open-access videos before proceeding to the narration below. Both videos are foundational for understanding the concepts in this unit.
Essential Watch
Short video explaining eutrophication, biodiversity loss, and ecosystem service decline.
Additional Watch
Analysis of freshwater and marine degradation pathways, including governance failures.
(Copyright: Video creators retain copyright. Links are to open-access educational content published on YouTube)
Narration: From Living Waters to Managed Waste Sinks
For most of human history, rivers, lakes, wetlands, and coastal systems functioned as biologically productive commons; shared resources that sustained fisheries, drinking water, nutrient cycling, flood regulation, and cultural life simultaneously. These systems were governed, imperfectly but often effectively, through customary arrangements that recognised their shared nature and limited extraction to what could be sustained.
Over the past century, and with accelerating intensity since the 1950s, a fundamental transformation has occurred. Aquatic systems have been progressively re-engineered as infrastructure for single-purpose human use (waste disposal, irrigation supply, hydropower generation, navigation) at the expense of their ecological integrity and their value as commons. Rivers have been straightened, dammed, and drained. Wetlands have been converted to agricultural and urban land. Coastal systems have been subjected to nutrient loads, sedimentation, and thermal stress far beyond what their biological communities can absorb.
The result is measurable and alarming. Nutrient runoff from fertilised agricultural landscapes, combined with inadequately treated urban wastewater, has intensified eutrophication (the over-enrichment of water with nutrients) on a global scale. Toxic algal blooms now affect more than 100,000 freshwater bodies worldwide (Huisman et al., 2018), periodically contaminating drinking water, suffocating fish populations, and generating economic losses in fisheries and tourism. The 2014 drinking water crisis in Toledo, Ohio — when a toxic cyanobacterial bloom in Lake Erie shut off the water supply to nearly half a million people for three days — illustrated in stark terms how biological processes in a degraded lake can cascade into an urban governance emergency.
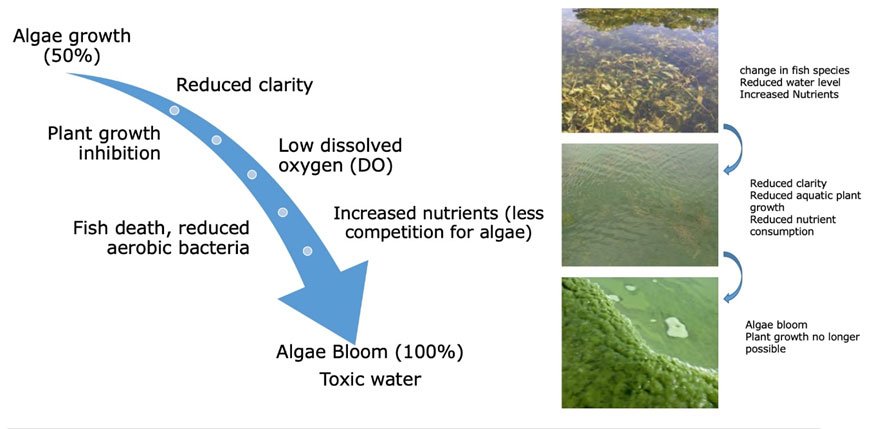
Figure 1.4.2: Progression of nutrient-driven algae bloom and its ecological impacts. Image Source: LG Sonic, https://www.weforum.org/stories/2022/09/freshwater-lakes-toxic-algal-bloom/
Freshwater biodiversity has declined sharply. A landmark global assessment published in Nature in 2025 found that approximately one-quarter of all known freshwater species (including fish, invertebrates, and amphibians) are now threatened with extinction (Sayer et al., 2025). These losses are not ecologically neutral as they dismantle the food webs, nutrient cycles, and predator-prey relationships that maintain water quality and productivity. Critically, biodiversity loss falls most heavily on communities for whom aquatic systems remain primary sources of food and livelihood — subsistence fishing communities, rural smallholders, and indigenous peoples, for whom the collapse of a river fishery is not an ecological statistic but a livelihood catastrophe.
Marine ecosystems reflect a parallel and, in some respects, more severe trajectory. Climate-driven coral bleaching has intensified to unprecedented levels, with 84% of global reef systems experiencing bleaching-level heat stress during the 2023–2025 global event, the most spatially extensive bleaching event ever recorded (ICRI, 2025). Coral reefs, which support fisheries, coastal protection, and tourism economies, have lost more than half their living cover since the mid-twentieth century. The human consequences are immediate and concentrated: for reef-dependent nations in the Pacific, Caribbean, and Indian Ocean, reef decline translates directly into reduced fish catches, lost tourism revenues, diminished coastal protection, and the erosion of cultural identities inseparable from living reefs.
Overfishing compounds biological stress across both freshwater and marine systems. The proportion of global fish stocks harvested beyond biologically sustainable limits has increased nearly fourfold since the 1970s (FAO, 2022), threatening the livelihoods of approximately 600 million people who depend directly or indirectly on fisheries for food and income.
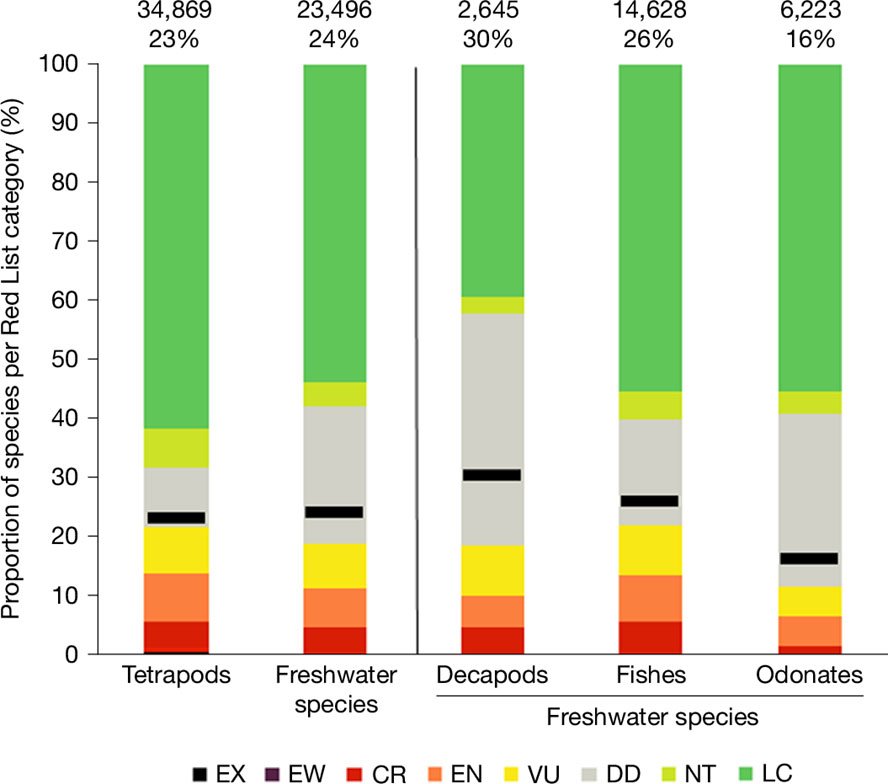
Figure 1.4.3: Freshwater species extinction risk — Bar chart showing the proportion of freshwater species threatened by taxon (decapod crustaceans, fish, odonates, amphibians), compared to combined tetrapods, using IUCN Red List categories. Source: Sayer et al. (2025).
What is essential to recognise is that these are not only ecological trends. They are social trends. They are the accumulated product of institutional arrangements — subsidies, permits, regulations that look the other way, legal frameworks designed for extraction rather than stewardship — that allow the costs of aquatic degradation to be socialised across entire populations, while the benefits of the activities driving that degradation are privately captured.
Reflective Questions (Mandatory for all students)
Please reflect on the following questions and post your thoughts in Forum W-001 under the tag "Reflective Questions 1.4". There are no right answers. We are interested in your analytical reasoning and, in the connections, you draw to your own professional context.
- In your country or region, can you identify a water body that is legally "compliant" with water quality regulations but ecologically impaired? What does this tell you about how water quality standards are designed?
- Which drivers of aquatic ecosystem degradation in your region are primarily biophysical, and which are primarily the result of governance decisions?
1.4.2 Ecological, Economic, and Public Health Consequences
Aquatic ecosystem degradation produces consequences that are ecological, economic, and public health-related simultaneously, and these consequences interact with and amplify one another in ways that are rarely captured by sectoral analysis.
Ecological Implications
When nutrient enrichment drives eutrophication, the most immediate ecological consequence is the depletion of dissolved oxygen. As algal biomass accumulates and eventually dies and sinks, microbial decomposition consumes oxygen in bottom waters, a condition known as hypoxia (dissolved oxygen below 2 mg/L). Under hypoxic conditions, most fish and bottom-dwelling invertebrates cannot survive. They either migrate to oxygenated areas, suffocate, or are excluded from large portions of their former habitat. Hypoxic conditions have been documented in more than 500 coastal systems globally (Diaz and Rosenberg, 2008) and in hundreds of inland lakes and rivers. The economic and ecological consequences of these "dead zones" (where productivity collapses, and biodiversity is dramatically reduced) extend far beyond the immediate affected area, disrupting food webs, fisheries, and ecosystem services at regional scales.
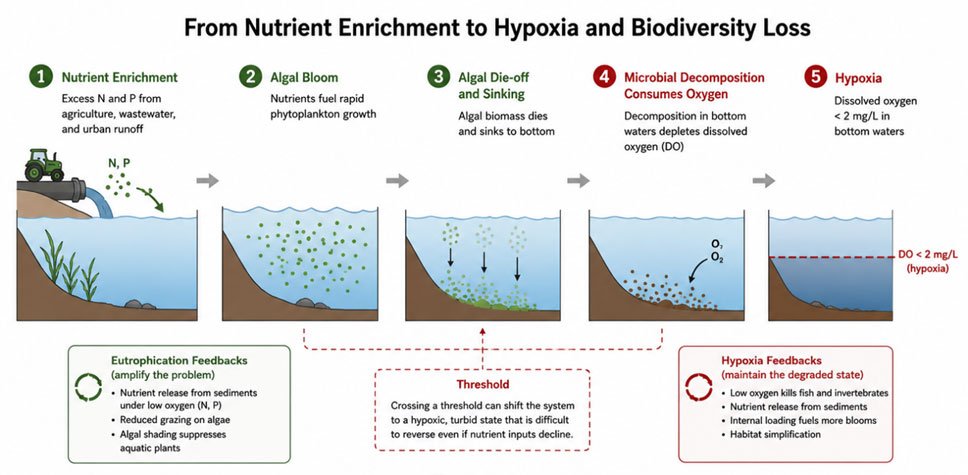
Figure 1.4.4: Schematic representation of eutrophication-driven hypoxia. Nutrient enrichment promotes algal blooms whose decomposition depletes dissolved oxygen, triggering hypoxic conditions, biodiversity decline, and reinforcing feedbacks that maintain ecosystem degradation. Source: Kartik Omanakuttan (Adopted from Diaz and Rosenberg, 2008, and Sayer et al., 2025)
Freshwater biodiversity loss is not simply a problem of losing individual species. Each species lost is a node in a network of ecological relationships. Predators that regulate prey populations, invertebrates that process organic matter, and fish that transport nutrients between habitats; their loss simplifies food webs and reduces the functional redundancy that gives ecosystems resilience against disturbance. As Sayer et al. (2025) document, the extinction risk for freshwater species now rivals that of the most threatened terrestrial groups, driven by a combination of habitat loss, pollution, water extraction, and invasive species introduction. Marine ecosystem decline follows analogous pathways. On coral reefs, bleaching events triggered by elevated sea temperatures cause corals to expel the symbiotic algae (zooxanthellae) that provide most of their energy. A single severe bleaching event can kill substantial proportions of living coral across an entire reef system; repeated bleaching events, which are now occurring with insufficient intervals for recovery, progressively reduce reef structural complexity, fisheries productivity, and capacity to provide coastal wave protection.
Public Health Implications
Harmful algal blooms (HABs), particularly blooms dominated by cyanobacteria such as Microcystis aeruginosa, produce toxins, including microcystins, that are potent liver toxins and probable human carcinogens. Microcystins are heat-stable and resistant to conventional water treatment. Exposure pathways include drinking water, recreational contact, and the consumption of fish or shellfish that have bioaccumulated the toxins. Chronic exposure has been associated with elevated rates of liver disease, bladder cancer, and neurological effects in communities relying on contaminated sources (WHO, 2020). The 2014 Toledo, Ohio drinking water shutdown (discussed in detail in Case Study 1.4-A below) illustrates how a bloom-driven water quality failure can become an acute urban health crisis with disproportionate impacts on lower-income residents unable to access alternative water supplies.
Beyond HABs, aquatic degradation interacts with drinking water infrastructure in numerous ways. Increased turbidity from erosion and algal blooms raises treatment costs. Salinisation of freshwater systems (driven by sea-level rise, irrigation return flows, and groundwater depletion) compromises the potability of water supplies for coastal and delta communities. The contamination of surface water sources with pathogens from inadequately treated wastewater remains the leading cause of waterborne disease globally, responsible for hundreds of thousands of deaths annually, concentrated in low-income countries with limited treatment infrastructure (WHO/UNICEF, 2021).
Economic Implications
The economic costs of aquatic ecosystem degradation are both direct and indirect.
Direct costs include: increased water treatment expenditure (for example, the addition of activated carbon filters to remove cyanotoxins from drinking water, at costs running to hundreds of millions of dollars for large utilities); fisheries losses from eutrophication, hypoxia and HABs; infrastructure damage from invasive species (zebra mussels, Dreissena polymorpha, clog water intake pipes at an estimated annual cost of approximately US$1 billion in North America alone (Thomas, 2010); and lost tourism and recreation revenue when water bodies become unsafe or aesthetically degraded.
Indirect costs — the loss of services that ecosystems provide free of charge — are harder to quantify but can be enormous. Wetlands that filter nutrients and regulate floods, once drained, must be replaced by engineered substitutes that cost vastly more. Coral reefs that protect coastlines from wave energy, once degraded, expose coastal communities to increased storm risk, driving investment in sea walls and breakwaters. The global economic value of reef ecosystem services — fisheries, coastal protection, tourism — has been estimated at approximately US$9–11 trillion per year (UNEP, 2018), with the caveat that such valuations are methodologically contested. What is not contested is that these services are real, they are currently being lost, and their loss transfers costs to coastal governments and communities who had no say in the governance decisions that drove reef degradation.
Plastic pollution represents a layer of degradation that is increasingly well-documented. Approximately 15 million tonnes of plastic enter the oceans annually (UNEP, 2021), where it fragments into microplastics that are ingested by marine organisms, enter food webs, and accumulate in tissues. The full ecological and economic consequences are still being quantified, but there is clear evidence of physiological stress in affected organisms and of trophic transfer up food chains to species consumed by humans.
Who Bears the Costs?
These impacts are profoundly unequally distributed. High-income regions and urban populations can buffer aquatic degradation through technological investment — advanced water treatment, purchased bottled water, and insurance against flood damage. Low-income and rural communities, and particularly indigenous and subsistence-dependent communities, typically lack these buffers. They rely on untreated or minimally treated water, depend directly on fish and aquatic resources for nutrition, and have neither the financial resources nor the political power to demand remediation of the degradation that affects them.
A subsistence fishing community on the Mekong, whose catch has declined by 40% because of upstream dam construction, does not have the option of purchasing farmed fish. A rural household in Bangladesh whose shallow well is contaminated does not have the option of switching to a piped water supply. A Pacific island community whose reef has bleached does not have the option of relocating its coastal economy. Understanding aquatic degradation, therefore, requires understanding not just what is being lost ecologically, but who bears the cost of that loss, and recognising that the communities who bear it most heavily are overwhelmingly those with the least power in the governance processes that produced the degradation in the first place.
1.4.3 Case Studies: Aquatic Degradation as a Governance Problem
Aquatic degradation is fundamentally a governance failure, not merely an ecological or technical problem. The central issue is a systematic mismatch between the scale and logic of ecological processes and the scale and logic of the institutions that govern them.
Consider how nutrient pollution works. Nutrients enter water bodies from diffuse sources across entire catchments — from millions of small agricultural fields, suburban lawns, improperly maintained septic systems, and urban stormwater drains. But regulatory frameworks are typically designed for point-source control: a factory has a discharge pipe; it can be monitored, permitted, and fined for violations. The farmer's field, the suburban lawn, the drainage ditch, these remain largely outside the enforcement logic of most water quality systems. The dominant source of aquatic degradation in most countries is therefore also the weakliest governed.
A second governance failure is the externalisation of environmental costs. Agricultural intensification generates private profits while transferring nutrient loads into shared water bodies. Industrial aquaculture generates private revenues while discharging waste into coastal ecosystems. Hydropower generates electricity revenue for shareholders while blocking fish migration and altering flow regimes for downstream communities, who receive no compensation. In each case, the ecosystem and the people who depend on it absorb costs that should, in any coherent economic or ethical framework, be borne by those who generated them.
A third failure is temporal: political systems operate on short cycles (annual budgets, four-year electoral terms) while ecological recovery operates on decades-long timescales. This structural mismatch consistently favours short-term extraction over long-term stewardship.
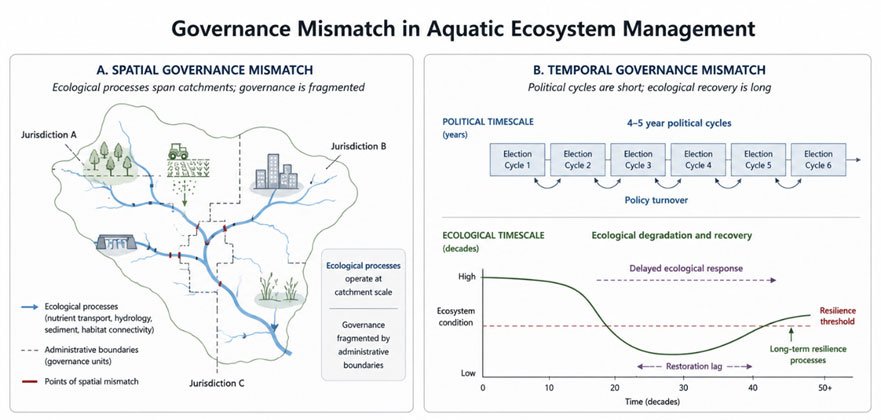
Figure 1.4.5: Governance mismatch in aquatic ecosystem management — a schematic showing the spatial mismatch between catchment-scale ecological processes and administrative governance boundaries, and the temporal mismatch between political cycles and ecological recovery timescales. (Adopted from Pambudi and Kusumanto, 2023, Winkler et al., 2021, Newton, 2021)
With this framework in mind, let us now examine two case studies that illustrate how these governance failures manifest in specific contexts.
Case Study 1: Harmful Algal Blooms and Drinking Water Security
Instructions for Students
Read the following case carefully and consider how it illustrates the governance dynamics described above. Pay attention not only to the scientific dimensions of the event but to the institutional failures that allowed it to occur and to the social inequalities that shaped who was most affected. After reading, initiate or contribute to a discussion in Forum W-001 under the tag "Case Study 1.4-A".
Case Study 1.4-A — Harmful Algal Blooms and Drinking-Water Governance: Lake Erie (western basin) and the 2014 Toledo water crisis
In the summer of 2014, a familiar ecological process in a heavily modified lake crossed an institutional threshold and became a public health emergency for nearly half a million people. The western basin of Lake Erie is shallow and warm — conditions that, when combined with elevated phosphorus concentrations, reliably generate summer blooms of Microcystis aeruginosa, the cyanobacterium responsible for producing microcystin toxins. On the morning of 2 August 2014, tests at the Collins Park Water Treatment Plant in Toledo, Ohio, detected microcystin concentrations above the World Health Organisation guideline value of 1 µg/L in treated water reaching residents. Within hours, the city issued a "do not drink, do not boil" advisory — boiling being ineffective against microcystins — affecting approximately 400,000–500,000 people across Toledo and surrounding communities.
The immediate consequences were both banal and alarming. Supermarkets were stripped of bottled water within hours. One resident described the scene as looking "like Black Friday". Distribution centres were established across the city. Schools were closed. Hospital procedures were disrupted. The Ohio governor declared a state of emergency, permitting the trucking of safe water into affected areas. "What's more important than water? Water's about life", the governor told reporters. The mayor pledged to his constituents: "We're going to be prepared to make sure people are not without water". The advisory was lifted after three days, once joint testing by city, state, and federal agencies confirmed that toxin concentrations had fallen below guideline levels.
Three days. But the conditions that produced the crisis had been accumulating for decades.
Scientifically, the Toledo event was entirely predictable. The western basin of Lake Erie receives nutrient loads (primarily dissolved reactive phosphorus) from an agricultural landscape covering millions of hectares across the Ohio, Indiana, and Michigan portions of the basin. Corn and soybean production, supported by fertiliser inputs and an extensive network of underground tile drains that efficiently move nutrients from fields into ditches and waterways, generates chronic phosphorus loading that has driven increasingly severe summer blooms since the 1990s. Satellite analyses of Lake Erie bloom intensity from 1984 to the present show a clear upward trend, accelerated by warming temperatures and the shift toward larger, more intense rainfall events that mobilise dissolved phosphorus from fields in pulses (Ho et al., 2019). The 2014 bloom was large, but it was not anomalous.
What was anomalous (or rather, what revealed the structural inadequacy of the governance system) was the response. The Toledo crisis exposed a fundamental regulatory gap. Agricultural runoff is classified in most jurisdictions as non-point source pollution, placing it largely outside the point-source discharge permitting and enforcement frameworks that govern industrial and municipal discharges. Farmers in the Lake Erie basin apply phosphorus to their fields in compliance with state agricultural guidelines, and those guidelines do not constrain total phosphorus loading to the lake below ecologically significant thresholds. The regulatory system was designed to manage industrial pipes, not agricultural landscapes.
Responsibility for phosphorus reduction in the Lake Erie basin is fragmented across farmers, drainage districts, municipal utilities, county governments, state environmental agencies, and federal bodies, with no single authority holding clear accountability for lake-scale outcomes. Water utilities, positioned at the end of this governance chain, are left to treat symptoms at the tap: advanced oxidation, powdered activated carbon, expensive equipment upgrades, all bearing costs that are passed to ratepayers rather than to the actors generating the phosphorus that makes such treatment necessary.
The crisis also revealed social inequalities that technical accounts often omit. Public health investigations following the advisory documented that lower-income households suffered disproportionate impacts: they had fewer financial resources to stockpile bottled water before the advisory, less flexibility to absorb the disruption to work and childcare, greater reliance on the public distribution system, and elevated anxiety about the safety of water even after the advisory was lifted. The psychosocial burden of living, even briefly, without safe tap water was real and unequally distributed.
The Toledo crisis sparked stronger nutrient-reduction targets for the Lake Erie basin and renewed inter-jurisdictional planning between Ohio, Michigan, Indiana, and Ontario. Progress has been made, but remains insufficient: bloom intensity in Lake Erie in subsequent years has not shown sustained decline. The structural tension persists: preventing HABs requires reducing nutrient loading at the basin scale, which requires changing the farming practices and drainage systems of thousands of individual landholders who bear the costs while the benefits of clean water flow downstream to others. This is a collective action problem, and it will not be resolved by water treatment technology or by emergency water trucks.
Short Quotations from the Event
- "It looked like Black Friday" — A Toledo resident, on the rush to buy bottled water, cited in TIME (Feeney, 2014).
- "We're going to be prepared to make sure people are not without water" — Toledo Mayor D. Michael Collins, during emergency operations (The Guardian, 2014).
- "What's more important than water? Water's about life" — Ohio Governor John Kasich, declaring a state of emergency (Kozacek, 2014).
Rask for Students
Analytical questions from the case study:
After reading, participants should answer the following question in Forum W-001 under the tag "Case Study 1.4-A".
1. In basin systems with widespread non-point nutrient inputs, what mix of regulatory and market instruments (for example, enforceable load allocations, fertilizer tax/subsidy reforms, payment for nutrient-reduction services) is likely to be politically feasible and ecologically effective?
Analysis Exercise
Participants are instructed to review the case of recurrent toxic algal blooms in large freshwater systems (e.g., North American and East Asian lakes). The task is to analyze how agricultural policy, urban wastewater management, and institutional fragmentation contribute to recurring water crises. Discussion to be initiated in Forum W-001, tag: Case Study 1.
Case Study 2: Coral Bleaching and Coastal Livelihoods
Instructions for Students
Read the following case, paying particular attention to the relationship between global-scale processes (ocean warming) and local governance responses, and to the multiple dimensions of human vulnerability that reef degradation produces. Contribute to the discussion in Forum W-001 under the tag "Case Study 1.4-B".
Case Study 1.4-B — Mass Coral Bleaching and Livelihood Loss: the 2023–25 global event and the regional human impacts
From January 2023 through the spring of 2025, the world experienced the most spatially extensive coral-bleaching event on record: satellite and field monitoring indicate that bleaching-level heat stress affected roughly 83–84% of global reef locations, with bleaching observed in at least 82–83 countries and territories. Scientists emphasize an important technical nuance— “84%” refers to reef systems experiencing heat stress sufficient to cause bleaching rather than implying that 84% of reef area everywhere has died—but the scale is nonetheless unprecedented and signals a new baseline of repeated, severe cardiac stress on reef ecosystems. For many reef nations, the result is not merely ecological loss but an abrupt economic and cultural shock. At the organismal level, bleaching occurs when corals, stressed by elevated sea temperatures, expel their symbiotic algae (zooxanthellae) that provide most of their energy. A single severe heatwave can kill substantial proportions of living coral; repeated heatwaves with little recovery interval reduce the resilience of reef assemblages, lower structural complexity, and trigger cascading declines in reef fishes and invertebrates. This structural simplification reduces fisheries productivity, degrades tourism assets, and removes a natural buffer that reduces coastal wave energy—so the consequences traverse food security, livelihoods, sovereign revenue, and shoreline safety. Long-term economic assessments placed the global value of reef ecosystem services in the trillions of dollars annually; contemporary syntheses estimate the order of magnitude of reef services globally at roughly US$9–11 trillion per year (estimates vary with methods). This is not an abstract valuation: for many small island states, reef fisheries and reef tourism represent a large share of GDP and are intimately woven into local food systems and cultural identity.
Reef managers often struggle with a scale mismatch between local conservation efforts and global ocean warming driven by greenhouse gas emissions, which they cannot directly control. While local policies can address issues like pollution and destructive fishing, leaders from reef nations emphasize the urgent need for action, framing ecological loss as a direct threat to community livelihoods. Responses have included accelerated reef restoration trials, local stressor reduction campaigns, and expanded marine protected areas. However, these initiatives are limited and face questions about ecological impacts and value prioritization. Ultimately, while local measures may help maintain some reef functions, they cannot replace the need for rapid global decarbonization to prevent mass bleaching.
On the social side, a blunt arithmetic emerges: fewer fish, fewer tourists, fewer dollars for coastal protection, and less cultural continuity for reef-dependent peoples. The human stories are often stark. For communities that derive most of their animal protein and income from reefs, repeated bleaching seasons mean fewer fish to catch, fewer dive tourists, and more precarious choices about migration or livelihood change. Economic valuations, while imperfect, help make the scale visible to ministries and international funders; for example, reports summarize the cumulative ecological and socioeconomic costs of reef loss and call for scaled finance for both mitigation and adaptation. Short direct quotations illustrate both grief and political urgency. Scientific programmes described the 2023–25 event as “the most spatially expansive on record” (NOAA/ICRI reporting), which frames the problem as both planetary and empirical. National leaders from island states frame the moral dimension: as Palau’s President put it, “we see our reefs damaged and livelihoods threatened,” a compact statement that links ecosystem damage to human security.
In practice, this case forces difficult tradeoffs for policymakers and reef communities. Local measures (fisheries restrictions, sewage controls, targeted restoration) are necessary and can buy time, but they do not address the dominant driver of these mass events. At the same time, telling reef communities that only global decarbonisation will prevent future bleaching risks can sound abstract and too slow. The policy challenge thus divides into three linked problems: (1) how to mobilise immediate relief and socio-economic support for reef-dependent people; (2) how to scale locally effective interventions where they can work (e.g., in refugia or where connectivity supports recovery); and (3) how to create credible global mitigation pathways that limit further damage. These are not sequential tasks but simultaneous political and technical dilemmas.
Key short quotations from the incident: “From 1 January 2023 to 30 March 2025, bleaching-level heat stress impacted 84% of the world’s reefs,” a summary of NOAA/ICRI observations. “We see our reefs damaged and livelihoods threatened,” President Surangel Whipps Jr. of Palau on the direct social impacts of bleaching in an official statement.
Task for Students
Analytical questions from the case study:
After reading, participants should answer the following questions in Forum W-001 under the same tag, which was used for the previous case study "Case Study 1.4-B".
- Given the scale of thermal stress, which local management interventions are likely to be cost-effective (and for which reef types/regions), and how should limited conservation finance be prioritised?
- How should international climate finance be designed to support both mitigation and the human adaptation needs of reef-dependent communities—i.e., what mix of loss & damage, adaptation grants, and targeted restoration funding is appropriate?
1.4.4 Legal and Policy Instruments Governing Aquatic Ecosystems
Aquatic ecosystem degradation does not occur in a legal vacuum. It is enabled by legal frameworks. Water quality regulations fix thresholds at levels safe for human use (drinking, swimming, irrigation) but below the thresholds that protect ecological integrity. Fisheries policies set catch limits based on single-species models that ignore ecosystem interactions, food web dependencies, and the nutritional needs of coastal communities. Coastal governance regimes separate land-based pollution from marine protection, ensuring that the chief sources of coastal degradation (agricultural runoff, urban wastewater, coastal development) are managed by agencies with no mandate to protect marine ecosystems. The result is a governance system that is simultaneously comprehensive on paper and ineffective in practice. This is not a coincidence. Legal frameworks reflect the interests of those with sufficient political and economic power to shape them. Farmers' lobbies, industrial dischargers, hydropower developers, and real estate interests have consistently shaped water governance to minimise their own compliance costs, externalising degradation costs onto water bodies and the communities that depend on them. Understanding the legal architecture of water governance is therefore inseparable from understanding the political economy of water use.
Water governance frameworks globally tend to operate through three primary regulatory logics:
- Water quality standards (compliance-based regulation): Numerical thresholds for pollutants (e.g., biochemical oxygen demand, nitrate, faecal coliforms) that dischargers must not exceed. These are the primary tools of most national water quality laws.
- Water allocation and use rights (quantity-based governance): Systems governing who is entitled to extract how much water from rivers, lakes, and aquifers, through licensing, permitting, or customary rights frameworks.
- Environmental protection instruments (ecosystem safeguards): Protected area designations, environmental flow requirements, habitat protection regulations, and impact assessment processes designed to prevent degradation beyond what compliance with quality and quantity standards alone would prevent.
These three logics exist in most jurisdictions, but they operate unevenly, frequently contradict each other, and in practice tend to prioritise the first two at the expense of the third.
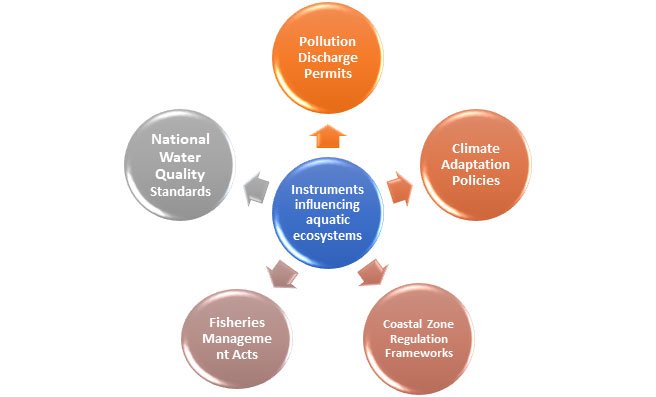
Figure 1.4.6: The five pillars of aquatic ecosystem governance — showing Water Quality Regulation, Water Allocation Rights, Environmental Protection, Fisheries Management, and Land Use Governance as interconnected but institutionally separated pillars. Source: Created by Kartik Omanakuttan
Why Water Quality Standards Fail Ecosystems?
A fundamental limitation of compliance-based water quality regulation is that it is anthropocentric, designed around thresholds safe for human uses rather than thresholds necessary for ecological integrity. Nitrate concentrations that are safe for drinking water may still be sufficient to drive eutrophication. Biochemical oxygen demand limits that protect swimming may permit chronic oxygen stress in sensitive invertebrate communities. Turbidity standards set for drinking water treatment may be ten times higher than the turbidity at which aquatic vegetation and spawning fish are severely affected. The practical consequence is that rivers and lakes can be declared legally "compliant" while their biological communities are profoundly impaired. This is not a technical oversight. It is a structural outcome of governance systems in which the regulated interests, dischargers, and water users are more politically powerful than the diffuse beneficiaries of clean water, and in which the ecosystems themselves have no legal standing.
The Non-Point Source Problem: A second systemic limitation is the regulatory dominance of point-source control frameworks in the face of predominantly non-point source pollution. Industrial and municipal discharges enter water bodies through identifiable pipes, making them amenable to permit-based regulation: a discharge consent specifies allowable concentrations of pollutants, and inspectors can monitor compliance and levy penalties for violations. Agricultural runoff — which is the dominant source of nutrient, sediment, and pesticide loading in most river basins globally — does not enter water through a pipe. It percolates through soils, moves along drainage ditches, and enters tributaries across the entire landscape. This diffuse, invisible character places it outside the logic of pipe-based permitting, and in most countries, agricultural pollution is addressed, if at all, through voluntary codes of practice, best management guidance, and incentive schemes, none of which carry the enforcement weight of statutory discharge limits. The consequences of this regulatory gap are visible across the world's most intensively farmed river basins.
Deep Focus: The Gulf of Mexico Hypoxic Zone
The Gulf of Mexico hypoxic zone, often called the "dead zone", is one of the most extensively studied examples of large-scale aquatic degradation driven by diffuse agricultural pollution. It is also one of the most instructive demonstrations of governance failure, because the science has been clear for decades, and the degradation has continued regardless. The zone forms annually in the northern Gulf of Mexico, off the coast of Louisiana, in the area where the Mississippi River discharges into the sea. The Mississippi-Atchafalaya River Basin, one of the largest river basins in the world, draining approximately 41% of the contiguous United States, delivers enormous quantities of nitrogen and phosphorus into the Gulf, primarily from maize and soybean agriculture across the Midwest. The process is straightforward. Nutrient-rich river water flows into the Gulf and stimulates the rapid growth of phytoplankton in surface waters. The algal biomass eventually sinks and is decomposed by bacteria in deeper water, consuming dissolved oxygen in the process. The Gulf's water column stratifies — a layer of lighter, warmer freshwater sits over denser, saltier marine water, preventing vertical mixing and replenishment of oxygen. The result is a zone of severely hypoxic water, typically forming in spring and persisting through late summer, where dissolved oxygen levels fall below 2 mg/L — levels at which shrimp, crabs, and most fish cannot survive. In peak years, the hypoxic zone has exceeded 20,000 square kilometres — larger than the state of New Jersey. The ecological consequences are substantial: benthic invertebrates die or are displaced; shrimp and fish are compressed into oxygenated areas, altering trophic dynamics and increasing competition; species composition shifts toward hypoxia-tolerant organisms; and productivity throughout the food web is disrupted. The governance story is instructive precisely because it represents a failure of knowledge application rather than a failure of knowledge. Scientists have understood the causes of Gulf hypoxia since at least the 1970s. A Mississippi River/Gulf of Mexico Hypoxia Task Force, established in 1997, set nutrient reduction targets and issued action plans. Yet hypoxia in the Gulf has not decreased significantly over more than three decades of monitoring and management effort.
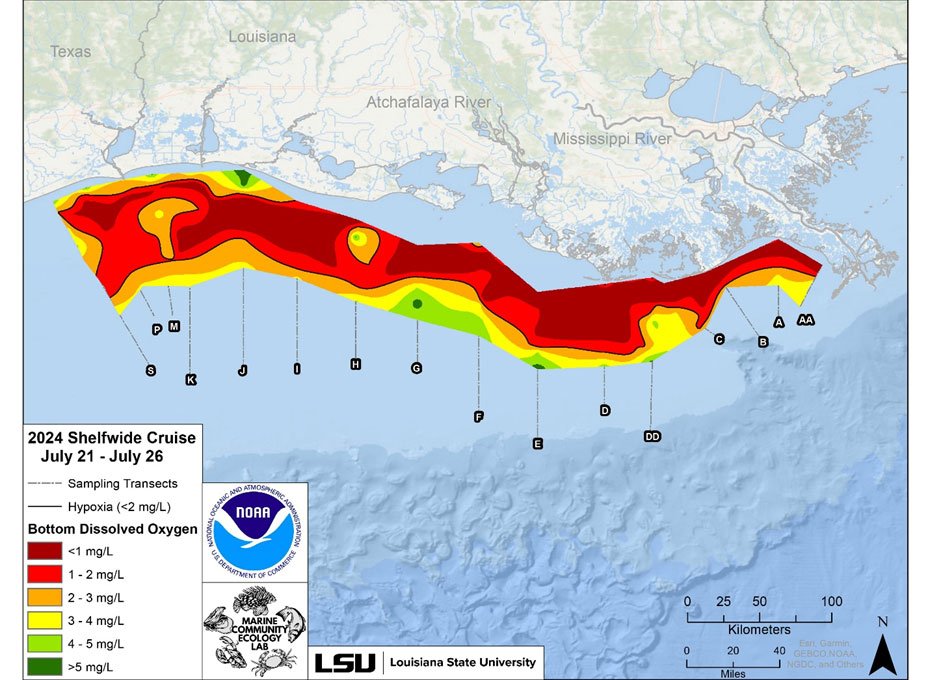
Figure 1.4.7: Aerial or satellite image of the Gulf of Mexico showing the extent of the hypoxic zone — typically visualised as oxygen-depleted bottom water mapped by research cruises. Courtesy: NOAA / open access
The reason is embedded in the governance structure. Nutrient loading is driven by agricultural practices across thousands of farms in multiple states, each individually making rational economic decisions in response to market prices, federal crop insurance programmes, and commodity subsidies. No single farmer's decision to apply fertiliser causes measurable harm; the harm emerges from the aggregate of millions of individual decisions. But no regulatory instrument holds any individual farmer accountable for that aggregate harm, and the political economy of farm-state legislatures makes it extremely difficult to impose meaningful fertiliser restrictions or nutrient pricing mechanisms. This is the principle the Gulf of Mexico case makes tangible:
When everyone is responsible for a fraction of the harm, and no single actor is accountable for the whole, governance fails.
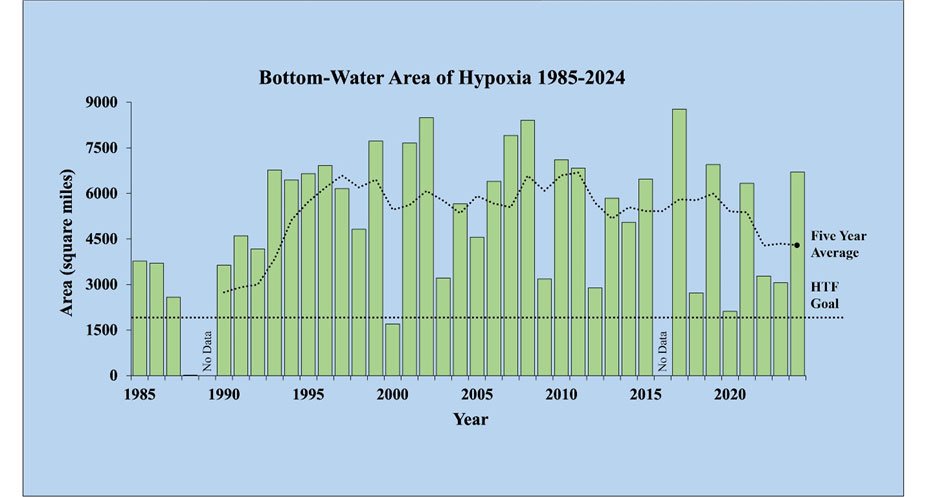
Figure 1.4.8: Temporal dynamics of the hypoxic area of the Gulf of Mexico. Source: NOAA / open access
Temporal dynamics compound the problem. Even if nutrient inputs to the Mississippi basin were substantially reduced tomorrow, nitrogen stored in agricultural soils and moving slowly through groundwater pathways would continue to reach the Gulf for years to decades. Recovery from eutrophication is slow, delayed, and uncertain. This makes it extremely difficult for politicians operating on electoral cycles to invest in measures whose benefits will not be visible within their term of office.
Emerging Policy Directions
Several governance approaches seek to address these structural limitations, though their implementation remains uneven.
- Integrated Water Resources Management (IWRM) attempts to coordinate water quality, quantity, and ecosystem governance across a single institutional framework, recognising that managing water in sectoral silos is the root of most governance failure. IWRM has been adopted as a principle in international water policy since the 1992 Dublin Principles, but its actual implementation varies enormously.
- River basin authorities and transboundary governance models — such as the Rhine Action Programme in Europe and the Murray-Darling Basin Authority in Australia — attempt to govern water at the ecologically relevant scale of the catchment rather than the administratively convenient scale of the municipality or state.
- Nutrient trading and market-based instruments allow polluters who reduce nutrient discharges below regulatory requirements to sell "nutrient credits" to dischargers who cannot meet their limits. In theory, this achieves cost-effective reduction at the system scale; in practice, such schemes have had mixed results, particularly where agricultural non-point sources are involved.
- Environmental flow requirements codify the minimum flows needed to maintain ecological function in rivers — an attempt to embed ecological values directly into water allocation law. Several countries, including Australia, South Africa, and parts of the EU, have incorporated environmental flow provisions into water legislation.
- The EU Water Framework Directive (WFD), adopted in 2000, represents the most comprehensive attempt yet to shift water governance from compliance-based standards to ecosystem-based outcomes. The WFD requires all member states to achieve "good ecological status" in all surface and groundwater bodies by specified dates, integrating biological, chemical, and hydromorphological criteria. Its implementation has been imperfect, and timelines have been repeatedly extended, but the framework's conceptual architecture — placing ecological integrity at the centre of water governance — represents a fundamental departure from anthropocentric quality standards.
However, implementation of all these approaches remains uneven, and particularly weak in low and middle-income countries where monitoring capacity, enforcement infrastructure, and institutional coordination are most limited.
Task for Students
You are advised to examine the water quality regulation framework in your own country or region and identify at least one of the following:
- Whether it prioritises ecosystem thresholds or human-use thresholds in setting water quality standards
- How (or whether) it addresses non-point source pollution from agriculture
- Whether water governance is integrated across sectors (agriculture, environment, fisheries, urban development) or governed through separate, poorly coordinated agencies
Post your findings in Forum W-001 under the tag "Policy Analysis Task 1.4". Where possible, name specific legislation and identify the institutional actors responsible for its implementation (and non-implementation).
1.4.5 Diversions and the Disruption of Aquatic Connectivity
Aquatic fragmentation is the disruption of ecological connectivity across spatial scales in freshwater and marine systems. Where rangelands can be fragmented by fences, roads, and land conversion, aquatic systems are fragmented by dams, weirs, diversions, drainage works, embankments, and the alteration of natural flow regimes — the seasonal rhythms of high and low water that cue fish migration, floodplain inundation, wetland filling, and delta replenishment. Connectivity in aquatic systems operates in three dimensions, all of which can be disrupted by human infrastructure:
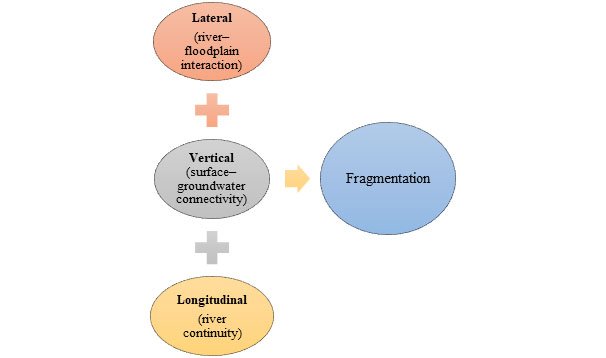
Figure 1.4.9: Three dimensions of aquatic connectivity — (1) Longitudinal, (2) Lateral, and (3) Vertical connectivity between surface water, hyporheic zone (the water beneath riverbed gravels), and groundwater. Source: Created by Kartik Omanakuttan
Longitudinal connectivity links habitats along the length of a river, from headwaters to sea. Its disruption, primarily by dams and weirs, blocks the upstream migration of fish seeking spawning grounds, prevents the downstream transport of sediments and organic matter, and truncates the range of migratory species. Lateral connectivity links the river channel to its floodplain and adjacent wetlands. During flood pulses, overbank flow moves nutrients, sediments, and organisms onto the floodplain, recharges floodplain wetlands, and provides the shallow, warm, productive waters in which many species breed and juveniles develop. Embankments, levees, and channel modifications that prevent flooding disconnect this lateral dimension, impoverishing both the river and the floodplain simultaneously. Vertical connectivity links surface water to shallow groundwater through the porous riverbed gravels, a zone called the hyporheic zone, and to deeper aquifers. This vertical exchange moderates water temperature, provides refugia for invertebrates during drought, and supports nutrient cycling. Excessive groundwater extraction near rivers can reverse this exchange, drawing river water into the aquifer rather than allowing groundwater to sustain river flows during dry periods.
Globally, more than 60% of large rivers are significantly fragmented by dams, barrages, and diversions (Grill et al., 2019). In heavily engineered basins (the Colorado, the Yangtze, the Nile, the Indus) natural flow regimes have been almost entirely replaced by regulated releases from dam reservoirs, designed to serve irrigation, hydropower, and urban supply rather than ecological function. Smaller structures (road culverts, low-head weirs, irrigation diversions) create what researchers have termed "invisible fragmentation," cumulatively disrupting thousands of smaller watercourses in ways rarely captured by large-scale infrastructure assessments.
Case Illustration: Mekong River Basin
The Mekong River Basin represents one of the most complex and contested examples of aquatic ecosystem fragmentation in the contemporary world. Extending across six countries—China, Myanmar, Laos, Thailand, Cambodia, and Vietnam—the Mekong supports one of the largest inland fisheries globally, estimated to produce over 2 million tonnes of fish annually and sustain the livelihoods of approximately 60 million people. This biological productivity is fundamentally dependent on the river’s natural flow regime, seasonal flood pulses, and uninterrupted connectivity along its length.
Historically, the Mekong functioned as a highly dynamic system characterized by strong monsoonal variability. Seasonal flooding connected the main river channel with extensive floodplains and wetlands, particularly in Cambodia’s Tonle Sap system, enabling nutrient exchange, sediment deposition, and fish migration. The Tonle Sap Lake, which expands several-fold during the wet season due to flow reversal in the Tonle Sap River, acts as a critical breeding and feeding ground for numerous fish species. This seasonal hydrological rhythm is central to the basin’s ecological functioning and food security. Over the past three decades, however, the Mekong has undergone rapid transformation due to hydropower development. Upstream dams in China’s Lancang cascade, combined with a surge of dam construction in Laos and planned projects throughout the basin, have begun to fundamentally alter flow regimes. These dams regulate seasonal discharge, reducing peak flood pulses and increasing dry-season flows, thereby flattening the natural hydrograph. While this stabilizes water availability for certain uses, it disrupts ecological cues that trigger fish migration and reproduction.
The fragmentation of the river by dams interrupts longitudinal connectivity, preventing migratory species from reaching spawning grounds. Many Mekong fish species are highly migratory, moving hundreds of kilometres along the river system. The installation of large dams without effective fish passage systems has led to measurable declines in fish populations, with projections suggesting reductions of 30–40% in fish biomass under full development scenarios. These impacts extend beyond biodiversity loss; they directly affect protein availability and livelihoods in rural communities where fish constitute a primary dietary component. Sediment transport is another critical dimension of fragmentation. The Mekong historically carried large sediment loads from upstream regions, replenishing floodplains and sustaining the delta in Vietnam. Dams trap significant portions of this sediment, reducing downstream deposition. The Mekong Delta, home to millions of people and a major agricultural region, is now experiencing increased erosion, subsidence, and salinity intrusion. These changes are exacerbated by sea-level rise, creating a compound risk that threatens long-term habitability and agricultural productivity.
What makes the Mekong case particularly instructive is the interplay between regional development priorities and transboundary governance limitations. Hydropower is framed as a pathway to economic development, especially for countries like Laos, which positions itself as the “battery of Southeast Asia.” However, the benefits of energy production are unevenly distributed, while the ecological and livelihood costs are borne disproportionately by downstream communities in Cambodia and Vietnam. The Mekong River Commission (MRC) provides a platform for cooperation among lower basin countries, but it lacks binding enforcement mechanisms, and upstream countries such as China are not full members. This creates asymmetries in decision-making and limits the effectiveness of basin-wide planning. Environmental Impact Assessments are typically conducted at the project level, failing to capture cumulative impacts across the basin.
The Mekong case exemplifies a broader governance challenge: how to reconcile infrastructure-led development with the preservation of ecological connectivity and ecosystem services. It raises fundamental questions about trade-offs between energy security, food security, and environmental sustainability, particularly in transboundary contexts where sovereignty and cooperation intersect.
Governance challenges often arise from fragmentation, which is rarely governed explicitly as a distinct category. Instead, it typically emerges as a side effect of various sectoral decisions, such as energy policy leading to the development of hydropower dams, agriculture policy resulting in irrigation diversions, and urban policy prompting the construction of flood control infrastructure. These individual decisions can collectively produce cumulative impacts that are seldom assessed in a holistic manner. Environmental Impact Assessments (EIAs) tend to be project-specific and often overlook the broader basin-wide effects that result from such fragmented approaches.
Task and Instructions for Participants
All participants are advised to carefully watch and listen to the following open-access video to develop a better understanding of the narration above. Then proceed to the narration below.
Essential Watch
Short video on the Mekong River Basin case.
While watching, keep this question in mind: What governance challenges are faced at the Mekong River Basin?
(Copyright: Video creators retain copyright. Links are to open-access educational content published on YouTube)
Recorded Lecture with Kartik Omanakuttan
Topic: Aquatic Ecosystems Under Pressure: Water Quality, Biodiversity, and Governance
Date:
Time: 16.30 Hours Central European Time (CET)
Prerequisite: Download and read the session note PDF before joining. The session will cover the ecological processes, human drivers, and governance challenges responsible for the degradation of aquatic ecosystems
1.4.6 Impacts of Fragmentation and Conversion
Fragmentation is closely linked to conversion — the transformation of aquatic ecosystems into systems optimized for specific human functions such as irrigation, hydropower, flood control, and navigation. This conversion fundamentally alters system behaviour.
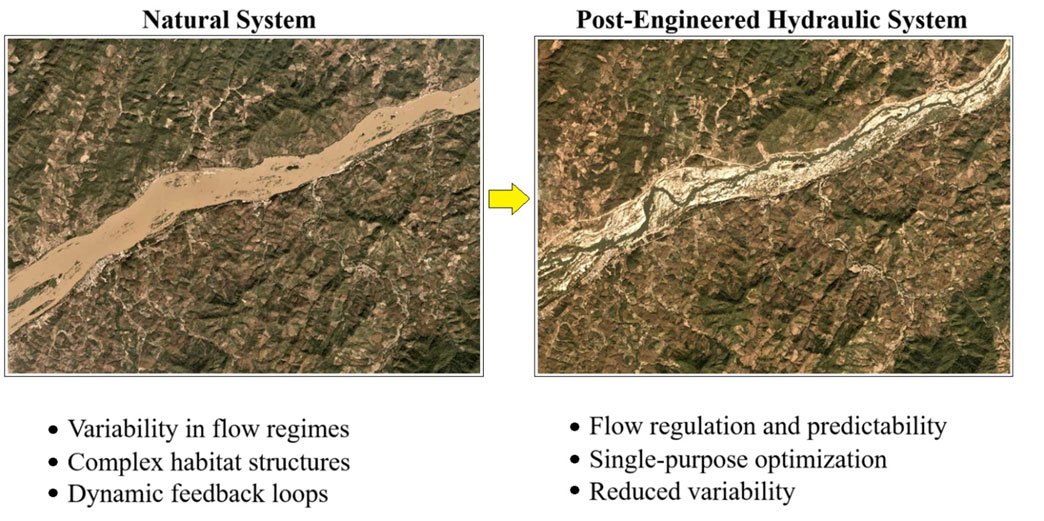
Figure 1.4.10: Left – Mekong River before January 2019, Right – Mekong River after January 2022. Source: Created by Kartik Omanakuttan, adopted from RFA (2022).
Impacts of these conversions can be clearly observed from the Mekong River case. Similar patterns emerge globally as the river regulation reduces peak flows, altering sediment transport and nutrient cycling, and floodplain isolation reduces biodiversity and agricultural productivity. Wetland drainage also eliminates natural water purification functions. For example, in the Colorado River Basin, flow regulation has reduced sediment supply to the delta, contributing to ecosystem collapse. In South Asia, embankments have altered floodplain dynamics, often increasing flood risk downstream rather than reducing it.
Temporal Mismatch: Benefits vs Costs
A critical analytical point is the temporal asymmetry:
- Benefits of conversion (e.g., irrigation, energy) are immediate and visible
- Ecological costs (e.g., biodiversity loss, sediment deficit) are delayed and cumulative
This creates a structural bias in decision-making toward short-term gains.
Fragmented and converted systems exhibit reduced resilience. Once thresholds are crossed, such as salinity accumulation, species loss, or sediment starvation, system recovery becomes difficult or impossible without major intervention. This is particularly relevant under climate change, where reduced resilience amplifies vulnerability to extreme events.
Read the Bare Fact: Who Bears the Cost of Aquatic Fragmentation?
The communities most severely affected by Mekong dam development — subsistence fishing households in Cambodia's Tonle Sap basin, smallholder farmers in Vietnam's Mekong Delta — are among the least powerful actors in the governance processes that produced the dams affecting them. They are not shareholders in the hydropower companies. They are not customers of the electricity exported. They did not sit in the capital city ministries where dam approval decisions were made. They are the downstream recipients of upstream decisions, absorbing costs for which they receive no compensation, made by actors over whom they have no influence.
This asymmetry is not unique to the Mekong. It is the characteristic political geometry of aquatic fragmentation worldwide: those who extract the benefits of water infrastructure sit upstream, geographically, politically, and economically, from those who bear the costs. Governance of aquatic fragmentation is fundamentally a governance of this asymmetry — a question of whose interests count, whose voices are heard, and whose losses are recognised.
Discussion Task for Students
Identify a water infrastructure project (dam, weir, irrigation diversion, drainage scheme, or embankment) in your own country or region. Describe the ecological connectivity it has disrupted (longitudinal, lateral, and/or vertical) and the communities most affected by that disruption. Was an environmental impact assessment conducted? If so, did it capture basin-wide cumulative impacts, or only project-level effects? Post your analysis in Forum W-001 under the tag "Fragmentation Discussion 1.4".
Mandatory Quiz: [Click Here]
Wrap Up Unit 1.4: Synthesis and Reflection
Please prepare a brief synthesis addressing the following three points and post your reflection in Forum W-001 under the tag "Wrap Up Unit 1.4":
- One new insight you have gained about aquatic ecosystem degradation, either scientific or governance-related, that changes how you understand a water issue in your professional context.
- One specific example of aquatic ecosystem degradation that you have observed or that is well documented in your region, and your assessment of whether it is primarily a scientific problem or a governance problem.
- Whether the water governance framework in your country addresses biological integrity, the ecological health of the water body, or manages only symptoms at the point of human use (treatment plants, fishing quotas, emergency responses).
Closing Note
Aquatic ecosystems communicate their distress in languages that governance systems are not designed to hear: the silent accumulation of nutrients in sediment, the slow disappearance of a species from a reach it has occupied for millennia, the gradual shortening of the oxygen season in a lake's deepest waters. By the time these signals translate into the political languages of public health crises, collapsed fisheries, or flooded coastlines, decades of degradation are already embedded in the system. Reversing that trajectory requires governance that is designed to hear the ecological signal early — before the crisis, not in response to it. That kind of governance does not emerge naturally from systems designed around short electoral cycles, sectoral ministries, and the interests of those who profit from water use. It must be built, deliberately and against resistance, by people who understand both the science and the politics of water.
References
Diaz, R.J., & Rosenberg, R. (2008) Spreading Dead Zones and Consequences for Marine
Ecosystems. Science, 321, 926-929. https://doi.org/10.1126/science.1156401
FAO (2022). The State of World Fisheries and Aquaculture 2022: Towards Blue Transformation.
https://doi.org/10.4060/cc0461en
Feeney, N. (2014, August 2). Toledo: Tap-water warning issued after toxin tests. TIME.
https://time.com/3074318/toledo-water/
Grill, G., Lehner, B., Thieme, M., Geenen, B., Tickner, D., Antonelli, F., ... & Zarfl, C. (2019).
Mapping the world’s free-flowing rivers. Nature, 569(7755), 215-221. https://doi.org/10.1038/s41586-019-1111-9
Ho, J. C., Michalak, A. M., & Pahlevan, N. (2019, October 14). Lakes worldwide are experiencing
more-severe algal blooms, 30 years of Landsat data shows. NASA Science. https://science.nasa.gov/missions/landsat/lakes-worldwide-are-experiencing-more-severe-algal-blooms-30-years-of-landsat-data-shows/
Huisman, J., Codd, G. A., Paerl, H. W., Ibelings, B. W., Verspagen, J. M., & Visser, P. M. (2018).
Cyanobacterial blooms. Nature Reviews Microbiology, 16(8), 471-483. https://doi.org/10.1038/s41579-018-0040-1
International Coral Reef Initiative (ICRI). (2025, April 23). 84% of the world’s coral reefs
impacted in the most intense global coral bleaching event ever. ICRI. https://icriforum.org/4gbe-2025/
Jeppesen, E., Søndergaard, M., Jensen, J. P., Havens, K. E., Anneville, O., Carvalho, L., ... &
Winder, M. (2005). Lake responses to reduced nutrient loading–an analysis of contemporary long‐term data from 35 case studies. Freshwater biology, 50(10), 1747-1771. https://doi.org/10.1111/j.1365-2427.2005.01415.x
Kozacek, C. (2014, August 2). Toledo issues emergency ‘Do not drink water’ warning to residents.
Circle of Blue. https://www.circleofblue.org/2014/world/toledo-issues-emergency-warning-residents-drink-water/
Millennium Ecosystem Assessment (2005). Ecosystems and Human Well-being: Synthesis. Island
Press, Washington, DC. https://www.millenniumassessment.org/documents/document.356.aspx.pdf
Newton, A. C. (2021). Ecosystem collapse and recovery. Cambridge University Press.
Pambudi, A. S., & Kusumanto, T. (2023). Water resources governance in Indonesia towards
environmental sustainability, along with social and economic development. In Environmental Governance in Indonesia (pp. 289-311). Cham: Springer International Publishing. https://doi.org/10.1007/978-3-031-15904-6_16
RFA (2022). Worries in Laos and Thailand as upstream dams drain Mekong River – Radio Free
Asia. Available online at: https://www.rfa.org/english/news/laos/mekong-water-01212022141419.html
Sayer, C. A., Fernando, E., Jimenez, R. R., Macfarlane, N. B., Rapacciuolo, G., Böhm, M., ... &
Darwall, W. R. (2025). One-quarter of freshwater fauna threatened with extinction. Nature, 638(8049), 138-145. https://doi.org/10.1038/s41586-024-08375-z
Scheffer, M., Hosper, S. H., Meijer, M. L., Moss, B., & Jeppesen, E. (1993). Alternative equilibria
in shallow lakes. Trends in ecology & evolution, 8(8), 275-279. https://doi.org/10.1016/0169-5347(93)90254-M
Spears, B. M., Hamilton, D. P., Pan, Y., Zhaosheng, C., & May, L. (2022). Lake management: is
prevention better than cure?. Inland Waters, 12(1), 173-186. https://doi.org/10.1080/20442041.2021.1895646
The Guardian. (2014, August 2). Toledo residents told not to drink water after pollution toxin
found. The Guardian. https://www.theguardian.com/world/2014/aug/02/toledo-residents-told-dont-drink-water-pollution-toxin?CMP=share_btn_url
Thomas, C. M. (2010). A cost-benefit analysis of preventative management for zebra and quagga
mussels in the Colorado-Big Thompson system [Masters’ Thesis]. Fort Collins, CO: Colorado State University. https://api.mountainscholar.org/server/api/core/bitstreams/de96c27d-29cb-4e34-965a-97110cf55749/content
United Nations Environment Programme (UNEP). (2018, July 11). The coral reef economy. UNEP.
https://www.unep.org/resources/report/coral-reef-economy
United Nations Environment Programme (UNEP). (2021). From Pollution to Solution: A Global
Assessment of Marine Litter and Plastic Pollution. https://www.unep.org/resources/pollution-solution-global-assessment-marine-litter-and-plastic-pollution
Winkler, K. J., Dade, M. C., & Rieb, J. T. (2021). Mismatches in the ecosystem services
literature—a review of spatial, temporal, and functional-conceptual mismatches. Current Landscape Ecology Reports, 6(2), 23-34. https://doi.org/10.1007/s40823-021-00063-2
World Health Organization (WHO) (2020). Arsenic (2022, updated factsheet).
https://www.who.int/news-room/fact-sheets/detail/arsenic
Suggested readings (selected):
Gido, K. B., Whitney, J. E., Perkin, J. S., & Turner, T. F. (2016). 10. Fragmentation, connectivity
and fish species persistence in freshwater ecosystems 2. ecosystems, 2, 3. https://doi.org/10.1017/CBO9781139627085.011 (Please check the available pdf document on researchgate)
Maila, D., Mathebula, V., Crafford, J., Mulders, J., & Eatwell, K. (2018). Towards the development
of economic policy instruments for sustainable management of water resources. Water Research, 1-109. https://www.wrc.org.za/wp-content/uploads/mdocs/2529_final.pdf
Sack, K., & Kurukulasuriya, P. (2025, January 21). Why coral reefs represent the ultimate climate
investment. World Economic Forum. https://www.weforum.org/stories/2025/01/coral-reefs-ultimate-climate-investment/
Science Feedback. (2025, April). 84% of the world’s reefs recently experienced bleaching-level
heat stress, but not all were completely bleached. Science Feedback. https://science.feedback.org/review/84-of-the-worlds-reefs-recently-experienced-bleaching-level-heat-stress-but-not-all-were-completely-bleached/
Wang, Y., Zhao, D., Woolway, R. I., Yan, H., Paerl, H. W., Zheng, Y., ... & Feng, L. (2025).
Global elevation of algal bloom frequency in large lakes over the past two decades. National Science Review, 12(3), nwaf011. https://doi.org/10.1093/nsr/nwaf011
NOAA Coral Reef Watch – Fourth Global Coral Bleaching Event.
https://www.noaa.gov/news-release/noaa-confirms-4th-global-coral-bleaching-event
ICRI (2024). NOAA and ICRI Confirm Fourth Global Coral Bleaching Event. 15 April 2024