Unit 2.4: Wetland Management
Instructor: Ms. Syeda Tabassum Tasfia
Wetlands are ecologically productive and hydrologically significant ecosystems, although productivity varies substantially among wetland types; for example, marshes and mangroves are often highly productive, whereas peatlands typically have lower aboveground productivity but exceptional carbon-storage capacity (Mitsch & Gosselink, 2023). Wetlands occupy the interface between land and water, and this transitional position underlies much of their functional richness. For many decades, however, wetlands were widely regarded as wastelands and were drained for agriculture, filled for development, or diverted for water supply. Over the past several decades, scientific and policy perspectives have shifted markedly: wetlands are now recognised as critical watershed infrastructure that purifies water, moderates floods, stores carbon, and supports biodiversity (Mitsch & Gosselink, 2023). This unit develops an understanding of wetland systems, moving from ecological principles to management planning and conservation.
Lecturer: Mr. Kartik Omanakuttan
Lecture Topic: Understanding Wetland Ecology, Functions, and its Management
Recorded Video: https://youtu.be/Ty2LdfQXViI
PPT File
2.4.1 Wetland Ecology
At the most fundamental level, wetlands are defined by the combined presence of water, hydric soils, and hydrophytic vegetation (Keddy, 2010). The Ramsar Convention adopts this broad conceptual basis while extending the definition to include a wide range of natural and human-made wetland types. What makes wetlands ecologically distinctive, however, is not only their definition but also the biogeochemical and physical processes generated under saturated and frequently anaerobic conditions. Wetlands are often described as the “kidneys of the landscape” because they intercept, transform, and store materials as water moves through them (Mitsch & Gosselink, 2023). Their functions may be broadly considered in hydrological, biogeochemical, biological, and socio-economic terms: hydrological functions include flood attenuation, groundwater recharge, and baseflow support; biogeochemical functions include nutrient cycling, carbon storage, and pollutant removal; biological functions include habitat provision, breeding grounds, and food-web support; and socio-economic functions include fisheries, agriculture, water supply, recreation, and cultural values (Mitsch & Gosselink, 2023).
These functions are interconnected rather than separate, because they arise from interactions among water, substrate, and biota, and disturbance in one component can cascade through the others (Keddy, 2010; Mitsch & Gosselink, 2023). One of the most important and historically underappreciated wetland functions is carbon storage. Wetlands occupy only a small fraction of the Earth’s land surface, yet they store a disproportionate share of global soil carbon, much of it as peat in waterlogged soils (Mitsch & Gosselink, 2023; Hiraishi et al., 2014). Under anaerobic conditions, partially decomposed organic matter accumulates slowly, allowing long-term carbon sequestration. When wetlands are drained, this stored carbon becomes vulnerable to oxidation and can be released as carbon dioxide, while altered microbial conditions may also increase methane emissions, making wetland degradation an important source of greenhouse gases (Hiraishi et al., 2014). This creates a direct link between wetland management and climate-change mitigation, a theme that reappears in Unit 2.6.
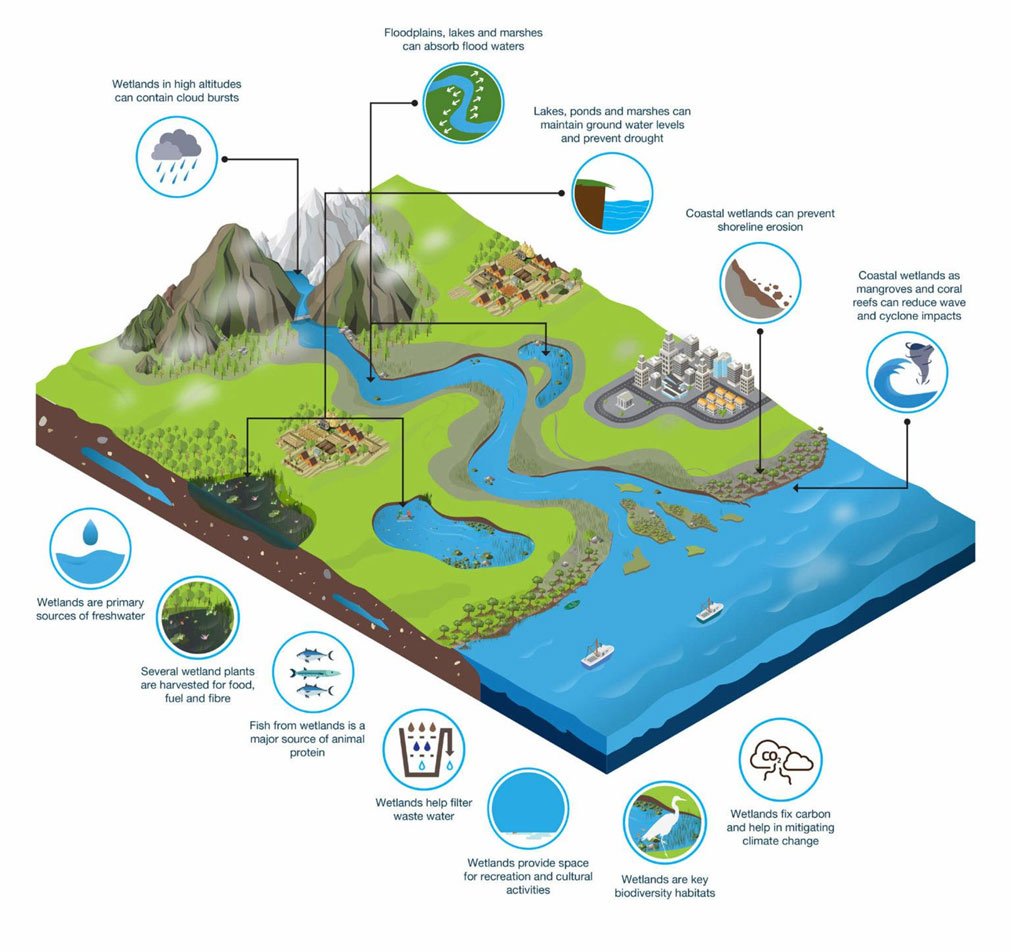
Figure 2.4.1.a: A diagram illustrating wetland ecosystem functions, including flood control, water purification, biodiversity, and coastal protection. (Image courtesy: Wetlands International. https://europe.wetlands.org/wetlands/what-are-wetlands/)
The physical architecture of a wetland is shaped by its hydrogeomorphic position, substrate characteristics, and vegetation communities (Brinson, 1993; Mitsch & Gosselink, 2023). At the most basic level, the abiotic framework consists of the hydrologic regime, hydric soils, and nutrient inputs from surface water, groundwater, and atmospheric deposition (Keddy, 2010; Reddy & DeLaune, 2008). The biotic framework consists of primary producers, consumers, and decomposers, which together regulate wetland metabolism and ecosystem processes (Mitsch & Gosselink, 2023; Keddy, 2010).
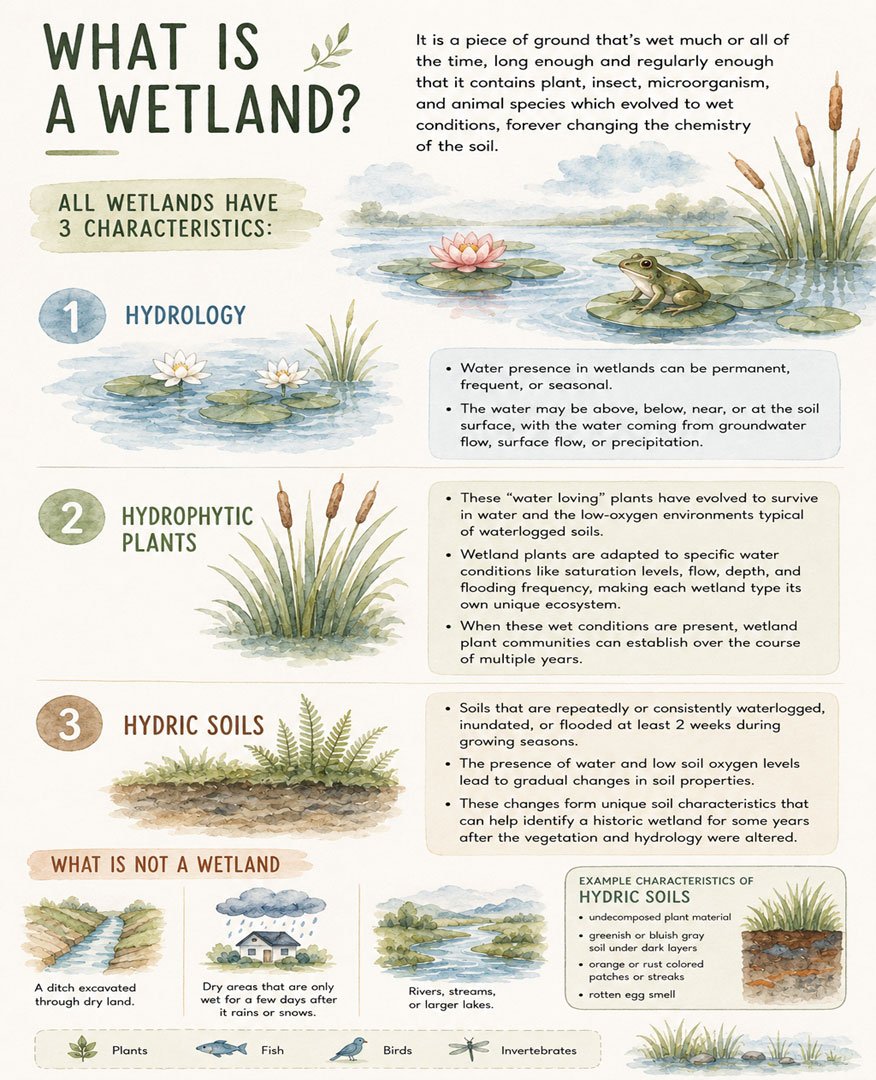
Figure 2.4.1.b. An educational infographic from The Wetlands Initiative illustrates the three defining characteristics of wetlands: hydrology, hydrophytic plants, and hydric soils, and contrasts wetland conditions with non-wetland settings. (Image courtesy: Adapted from https://www.wetlands-initiative.org/. Colour palette modified to match document design.)
Hydrophytic plants are the principal structural components of wetland ecosystems. Emergent macrophytes such as Phragmites australis, Typha spp., and Schoenoplectus spp. colonize shallow-water and littoral zones, where they slow water movement, enhance sediment deposition, and provide habitat for birds, fish, and invertebrates (Mitsch & Gosselink, 2023; Cronk & Fennessy, 2001). Submerged macrophytes, including species of Potamogeton and Chara, dominate permanently inundated zones and contribute to primary production, nutrient uptake, and habitat complexity (Keddy, 2010). In peatlands, Sphagnum mosses function as ecosystem engineers by acidifying the environment and accumulating partially decomposed organic matter, thereby forming peat and gradually raising the wetland surface over long time scales (Rydin & Jeglum, 2013). Wetland vegetation, therefore, both responds to and modifies hydrological and geochemical conditions, creating strong feedbacks that shape ecosystem functioning.
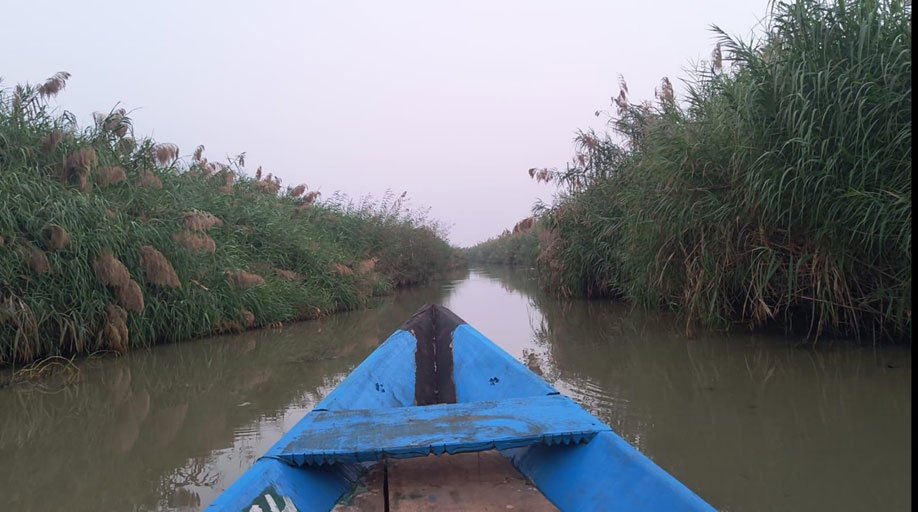
Figure 2.4.1.c: A photograph of hydrophytic vegetations in the Chilika Lake. (Image courtesy: Syeda Tabassum Tasfia.)
The decomposer community is less visible but functionally essential. Under anaerobic soil conditions, microbial communities mediate sulphate reduction, methanogenesis, and denitrification, processes that are limited or absent in well-oxygenated soils (Reddy & DeLaune, 2008; Mitsch & Gosselink, 2023). Denitrification is a key mechanism by which wetlands permanently remove reactive nitrogen, converting nitrate to gaseous forms of nitrogen during microbial respiration (Reddy & DeLaune, 2008; Kadlec & Wallace, 2009). Methanogenesis, by contrast, generates methane, an important greenhouse gas, illustrating that some wetland processes involve trade-offs between water-quality improvement and climate forcing (Bridgham et al., 2006).
Linkages Between Wetlands and Watersheds
Wetlands do not function in isolation; they are integral components of watershed systems, and their ecological roles are closely linked to upstream and downstream processes (Mitsch & Gosselink, 2023). Floodplain and riparian wetlands receive runoff, sediments, nutrients, and organic matter from upland catchments. Through sedimentation, nutrient uptake, and microbial transformations, wetlands modify these inputs before water is released downstream (Keddy, 2010; Reddy & DeLaune, 2008). As ecotones between terrestrial and aquatic environments, wetlands regulate the transfer of materials, energy, and organisms across ecosystem boundaries.
This connectivity operates at multiple spatial scales. At the local scale, a riparian wetland may intercept shallow subsurface flow from adjacent agricultural land, reducing nitrogen and phosphorus loads before they reach streams (Mitsch & Gosselink, 2023; Kadlec & Wallace, 2009). At the landscape scale, networks of wetlands distributed throughout a watershed can collectively reduce flood peaks, delay runoff, and sustain streamflow during dry periods by storing and gradually releasing water (Bullock & Acreman, 2003; Acreman & Holden, 2013). The magnitude of these functions depends on wetland size, type, position in the catchment, antecedent conditions, and hydrologic connectivity (Acreman & Holden, 2013; Golden et al., 2017). Studies by researchers and management agencies have shown that wetland loss can increase downstream flood risk and degrade water quality, although the effects vary depending on watershed characteristics and the extent of wetland alteration (Mitsch & Gosselink, 2023; Golden et al., 2017).
Task for Students
The "kidneys of the landscape" metaphor is powerful but may not capture all of what wetlands do. Drawing on what you have studied in this sub-unit, and on your own field or regional experience, do you think this metaphor is adequate? What other metaphors or framings might convey wetland value to a non-scientific audience or to policy makers in your country? Post your reflection in Forum W-001.
References
Brinson, M. M. (1993). A hydrogeomorphic classification for wetlands. U.S. Army Corps of
Engineers. https://wetlands.el.erdc.dren.mil/pdfs/wrpde4.pdf
Bridgham, S. D., Megonigal, J. P., Keller, J. K., Bliss, N. B., & Trettin, C. (2006). The carbon
balance of North American wetlands. Wetlands, 26(4), 889–916. https://repository.si.edu/bitstream/handle/10088/18978/serc_Bridgham_Megonigal_Others_2006.pdf
Bullock, A., & Acreman, M. (2003). The role of wetlands in the hydrological cycle. Hydrology
and Earth System Sciences, 7(3), 358–389. https://doi.org/10.5194/hess-7-358-2003https://hess.copernicus.org/articles/7/358/2003/hess-7-358-2003.pdf
Cronk, J. K., & Fennessy, M. S. (2001). Wetland plants: Biology and ecology. CRC Press.
Golden, H. E., Lane, C. R., Amatya, D. M., Bandilla, K. W., Raanan-Kiperwas, H., Knightes, C.
D., & Ssegane, H. (2013). Hydrologic connectivity to streams increases nitrogen and phosphorus export from depressional wetlands. Journal of Environmental Quality, 42(4), 958–968. https://doi.org/10.2134/jeq2012.0466https://pubmed.ncbi.nlm.nih.gov/24216376/
Hiraishi, T., Krug, T., Tanabe, K., Srivastava, N., Baasansuren, J., Fukuda, M., & Troxler, T. G.
(Eds.). (2014). 2013 supplement to the 2006 IPCC guidelines for national greenhouse gas inventories: Wetlands. IPCC. https://www.ipcc-nggip.iges.or.jp/public/wetlands/https://www.ipcc.ch/publication/2013-supplement-to-the-2006-ipcc-guidelines-for-national-greenhouse-gas-inventories-wetlands/
Kadlec, R. H., & Wallace, S. D. (2009). Treatment wetlands (2nd ed.). CRC Press.
Keddy, P. A. (2010). Wetland ecology: Principles and conservation (2nd ed.). Cambridge
University Press. https://doi.org/10.1017/CBO9780511778179https://api.pageplace.de/preview/DT0400.9781139210591_A23866942/preview-9781139210591_A23866942.pdf
Mitsch, W. J., Gosselink, J. G., Anderson, C. J., & Fennessy, M. S. (2023). Wetlands (6th ed.).
Wiley. https://www.wiley.com/en-us/Wetlands%2C+6th+Edition-p-00354180
Ramsar Convention on Wetlands. (2018). An introduction to the Convention on Wetlands (5th
ed.). Ramsar Secretariat. https://www.ramsar.org/sites/default/files/documents/library/handbook1_5ed_introductiontoconvention_final_e.pdf
Reddy, K. R., & DeLaune, R. D. (2008). Biogeochemistry of wetlands: Science and applications.
CRC Press. https://doi.org/10.1201/9780203491454https://books.google.dk/books?id=8yLE_tMMTl8C
Rydin, H., & Jeglum, J. K. (2013). The biology of peatlands (2nd ed.). Oxford University Press.
https://books.google.com/books/about/The_Biology_of_Peatlands.html?id=0itoAgAAQBAJ
Unit 2.4.2 Wetland Types and Distribution
The diversity of wetland types reflects the wide range of climatic, hydrological, geomorphological, and geological conditions under which wetlands form and persist. Because wetlands occur along continua of hydrology, salinity, vegetation, and geomorphology, no single classification system captures all dimensions of wetland diversity. Nevertheless, two frameworks are particularly influential: the Cowardin classification, developed for the U.S. Fish and Wildlife Service, and the classification adopted under the Convention on Wetlands (Ramsar Convention Secretariat, 2024; Cowardin et al., 1979).
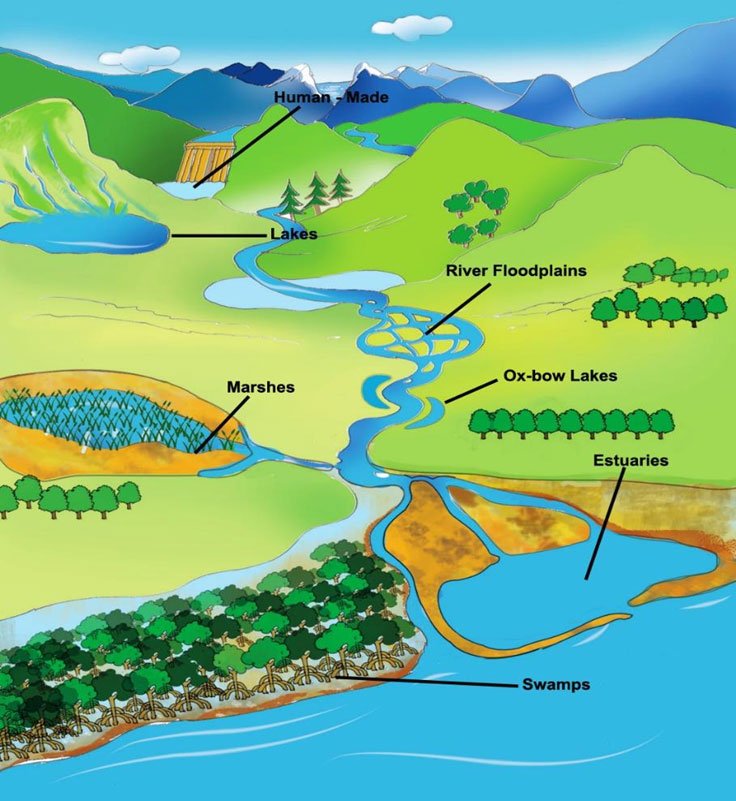
Figure 2.4.2.a: Schematic representation of selected wetland types, showing human-made wetlands, lakes, river floodplains, ox-bow lakes, marshes, estuaries, and swamps. Indian Wetlands Portal. (n.d.). Wetland types. Ministry of Environment, Forest & Climate Change, Government of India. https://indianwetlands.in/wetlands-overview/wetland-types/
The Cowardin system provides a hierarchical approach based on ecological and hydrological characteristics and recognises five major systems: Marine, Estuarine, Riverine, Lacustrine, and Palustrine. The Marine system includes open ocean and exposed coastlines; the Estuarine system encompasses semi-enclosed coastal waters where ocean water is diluted by freshwater; the Riverine system includes channels and associated floodplains of rivers and streams; the Lacustrine system covers lakes and reservoirs deeper than 2 m with limited emergent vegetation; and the Palustrine system includes inland marshes, swamps, bogs, fens, and shallow ponds dominated by emergent vegetation, shrubs, or trees (Cowardin et al., 1979). Although originally developed for the United States, the Cowardin framework has influenced wetland inventories and ecological assessments worldwide.
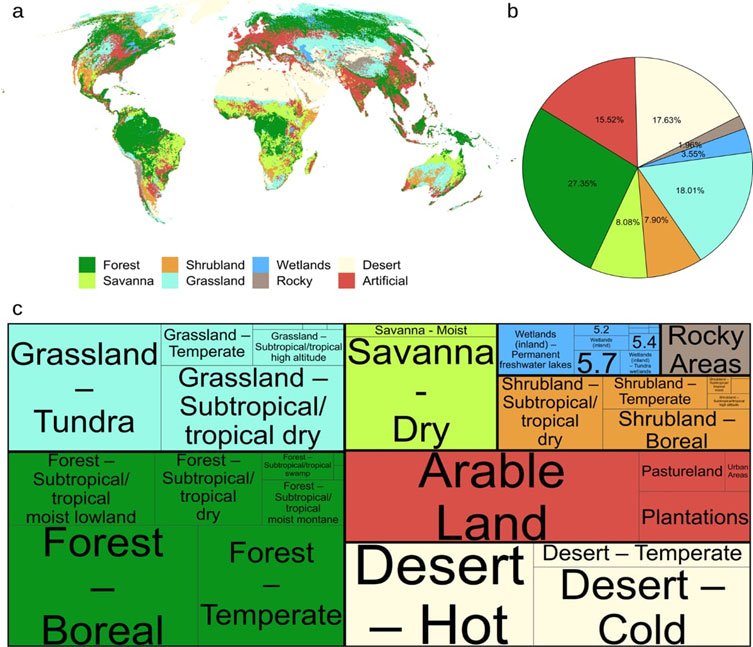
Figure 2.4.2.b: Distribution of IUCN habitat classes globally (a) Showing the Level 1 classification (coarsened to ~5 km for this visualization). (b) Proportion of global land area occupied by each Level 1 IUCN habitat class. (c) Tree map showing the most dominant IUCN habitat class at Level 216 nested within the Level 1 classes. (Image courtesy: Scientific Data, A global map of terrestrial habitat types | Scientific Data – Naturehttps://www.nature.com/articles/s41597-020-00599-8#Fig2
At the international level, the Ramsar Convention recognises 42 wetland types grouped into three broad categories: Marine and Coastal Wetlands, Inland Wetlands, and Human-Made Wetlands (Ramsar Convention Secretariat, 2024). Marine and coastal wetlands include mangroves, coral reefs, estuaries, and intertidal mudflats. Inland wetlands include rivers, lakes, peatlands, marshes, and springs. Human-made wetlands include reservoirs, rice paddies, aquaculture ponds, salt pans, and wastewater treatment wetlands. The inclusion of human-made wetlands acknowledges that anthropogenic systems can provide important ecological functions, such as water purification, flood attenuation, and habitat for migratory birds. For example, rice paddies in Asia support substantial populations of waterbirds, while also contributing to methane emissions under flooded conditions (Bambaradeniya & Amerasinghe, 2003; Ramsar Convention Secretariat, 2024; Saunois et al., 2020).
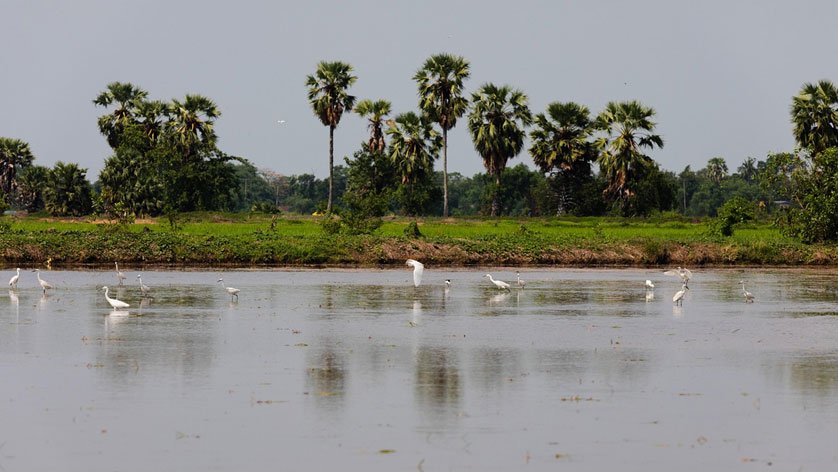
Figure 2.4.2.c: Waterbirds foraging in flooded rice paddies in Asia. Rice paddies function as human-made wetlands, providing habitat for migratory and resident waterbird species while contributing to methane emissions under flooded conditions. (Image courtesy: https://pixabay.com)
Climate exerts a strong influence on wetland distribution and dominant wetland types. Tropical and subtropical regions support mangrove forests, peat swamp forests, and extensive river floodplains, such as the Amazon várzea and the Inner Niger Delta. Temperate regions commonly contain marshes, wet meadows, riparian wetlands, and estuarine salt marshes. Boreal and Arctic regions are dominated by peatlands, including bogs and fens, which store about one-third of the world’s soil carbon despite covering only a small fraction of terrestrial land area (Gorham, 1991; Hugelius et al., 2020). Arid and semi-arid regions contain ephemeral wetlands such as playas, inland salt lakes, and desert oases, which provide critical refugia for biodiversity and important stopover habitat for migratory species (Williams, 2002).
2.4.2.1 Spatial Distribution and Controlling Factors
The global distribution of wetlands is governed by the interaction of climate, topography, geology, soils, and hydrology. Wetlands develop where water is present at or near the land surface for sufficient periods to create hydric soils and support hydrophytic vegetation (Mitsch & Gosselink, 2023). Three broad conditions are typically required for wetland formation:
- A sustained water source, including precipitation, groundwater discharge, river flooding, or tidal inundation.
- A landscape position that impedes drainage, such as depressions, floodplains, coastal lowlands, and valley bottoms.
- A substrate that retains water, including clay-rich soils, organic soils, impermeable bedrock, or permafrost.
Where these factors coincide, wetlands can develop and persist; where one or more are absent, wetlands may be absent or only seasonally present.
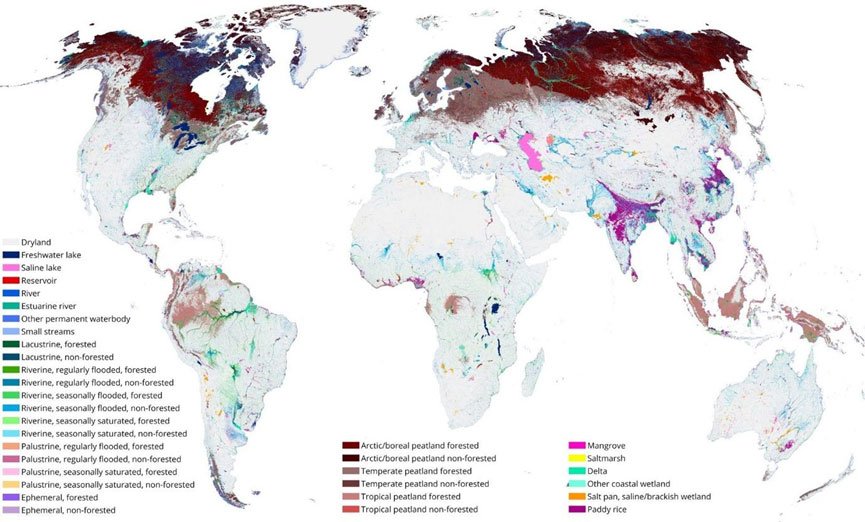
Figure 2.4.2.b: HydroSHEDS documentation provides a figure showing Global Lakes and Wetlands Database (GLWD v2) – global distribution of inland waterbodies and wetlands. (Image courtesy: Mapping the world's inland surface waters: an upgrade to the Global Lakes and Wetlands Database (GLWD v2). https://essd.copernicus.org/articles/17/2277/2025/#&gid=1&pid=1)
Geological history strongly influences wetland distribution at regional and local scales. In formerly glaciated regions, retreating ice sheets created depressions that became prairie potholes, kettle lakes, and peat-filled basins. The Prairie Pothole Region of North America supports one of the most productive waterfowl breeding areas in the world (Dahl, 2014). In karst landscapes, dissolution of limestone produces sinkholes, springs, and groundwater-fed wetlands. In volcanic landscapes, lava flows and crater depressions can create localized wetlands. Along coasts, wetland occurrence depends on tidal range, wave energy, relative sea-level change, and sediment supply. Mangroves and salt marshes typically develop in sheltered, sediment-rich environments where accretion keeps pace with sea-level rise (Kirwan & Megonigal, 2013).
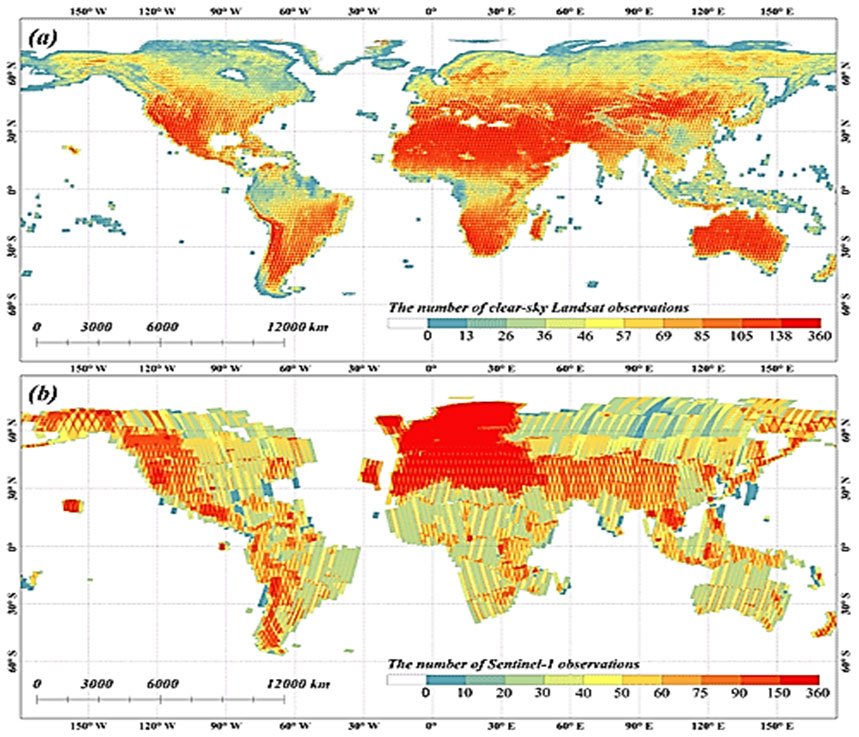
Figure 2.4.2.c: Global 30m resolution wetland map (GWL_FCS30) produced from Sentinel satellite observations, an example of modern remote sensing applications in wetland inventory (Image courtesy: ESSDhttps://essd.copernicus.org/articles/15/265/2023/)
Recent advances in satellite remote sensing have significantly improved estimates of global wetland extent. The Global Wetland Outlook estimated that wetlands cover approximately 12.1 million km² worldwide, while acknowledging substantial uncertainty due to inconsistent definitions and mapping limitations (Ramsar Convention Secretariat, 2018). More recent datasets, such as the GWL_FCS30 global 30-m wetland map derived from Landsat and Sentinel imagery, provide finer spatial detail and improved detection of inundated and vegetated wetlands (Zhang et al., 2023). Accurate spatial data are essential for wetland conservation planning, ecosystem service assessment, climate change mitigation, and reporting under international agreements such as the Ramsar Convention.
Tasks for Students
- Using published maps, national reports, or your own regional knowledge, identify a wetland complex in your country or region. Describe its type (using either the Cowardin or Ramsar classification), explain the controlling factors responsible for its formation and persistence, and discuss any significant threats to its continuity. Share in Forum W-001.
- Watch the Video: https://youtu.be/tEOMsljYv6E
The video gives an overview of the different wetland types of coastal South Carolina. - Watch Video: https://youtu.be/4bRgUShrC1w
This video provides an overview of major wetland types, including mangroves, marshes, swamps, bogs, and peatlands, highlighting their hydrological characteristics, ecological functions, and importance for biodiversity conservation and ecosystem stability.
References
Bambaradeniya, C. N. B., & Amerasinghe, F. P. (2003). Biodiversity associated with the rice
field agroecosystem in Asian countries: A brief review (Working Paper No. 63). International Water Management Institute.
Cowardin, L. M., Carter, V., Golet, F. C., & LaRoe, E. T. (1979). Classification of wetlands and
deepwater habitats of the United States (FWS/OBS-79/31). U.S. Fish and Wildlife Service. https://www.fws.gov/wetlands/Documents/Classification-of-Wetlands-and-Deepwater-Habitats-of-the-United-States.pdf
Dahl, T. E. (2014). Status and trends of prairie wetlands in the United States 1997 to 2009. U.S.
Department of the Interior, Fish and Wildlife Service.
Gorham, E. (1991). Northern peatlands: Role in the carbon cycle and probable responses to
climatic warming. Ecological Applications, 1(2), 182–195. https://doi.org/10.2307/1941811
Hugelius, G., Loisel, J., Chadburn, S., et al. (2020). Large stocks of peatland carbon and nitrogen
are vulnerable to permafrost thaw. Proceedings of the National Academy of Sciences, 117(34), 20438–20446. https://doi.org/10.1073/pnas.1916387117
Kirwan, M. L., & Megonigal, J. P. (2013). Tidal wetland stability in the face of human impacts
and sea-level rise. Nature, 504(7478), 53–60. https://www.nature.com/articles/nature12856
Lehner, B., & Döll, P. (2004). Development and validation of a global database of lakes,
reservoirs and wetlands. Journal of Hydrology, 296(1–4), 1–22. (Data distributed as GLWD v2 via HydroSHEDS: https://www.hydrosheds.org/products/glwd).
Mitsch, W. J., Gosselink, J. G., Anderson, C. J., & Fennessy, M. S. (2023). Wetlands (6th ed.).
Wiley. https://www.wiley.com/en-us/Wetlands,+6th+Edition-p-00354180
Ramsar Convention Secretariat. (2018). Global wetland outlook: State of the world’s wetlands
and their services to people. Convention on Wetlands. https://www.ramsar.org/resources/global-wetland-outlook
Ramsar Convention Secretariat. (2024). The Ramsar Convention classification system for
wetland type. Convention on Wetlands. https://www.ramsar.org/document/annotated-ramsar-list-wetland-type-classification
Saunois, M., Stavert, A. R., Poulter, B., et al. (2020). The global methane budget 2000–
2017. Earth System Science Data, 12, 1561–1623. https://doi.org/10.5194/essd-12-1561-2020
Williams, W. D. (2002). Environmental threats to salt lakes and the likely status of inland saline
ecosystems in 2025. Environmental Conservation, 29(2), 154–167. https://doi.org/10.1017/S0376892902000103
Zhang, Y., Xiao, X., Jin, C., et al. (2023). GWL_FCS30: A global 30-m wetland map with a fine s
classification system for 2020 based on time-series Landsat and Sentinel-1 data. Earth System Science Data, 15, 265–293. https://doi.org/10.5194/essd-15-265-2023
Unit 2.4.3 Wetland Hydrology
Hydrology is widely regarded as the primary controlling factor in wetland ecosystems because it determines soil saturation, redox conditions, nutrient availability, vegetation composition, and biogeochemical functioning (Mitsch & Gosselink, 2023; Keddy, 2010). While wetland soils and plant communities may change gradually over time, alterations in hydrological conditions can rapidly transform wetland structure and ecological function (Winter, 1999; Winter et al., 1998). The hydrological regime, including the timing, duration, depth, frequency, and seasonality of inundation or soil saturation, largely determines whether a wetland develops and what ecological characteristics it exhibits (Mitsch & Gosselink, 2023; Winter et al., 1998).
A central concept in wetland hydrology is the hydroperiod, defined as the seasonal pattern and duration of water presence within a wetland. Hydroperiod strongly influences wetland vegetation zonation, soil oxygen availability, decomposition rates, and faunal communities (Keddy, 2010; Winter et al., 1998). Even relatively small changes to hydroperiod caused by drainage, river regulation, groundwater abstraction, or impoundment can significantly alter wetland ecological processes and biodiversity (Winter, 1999; Sophocleous, 2002).
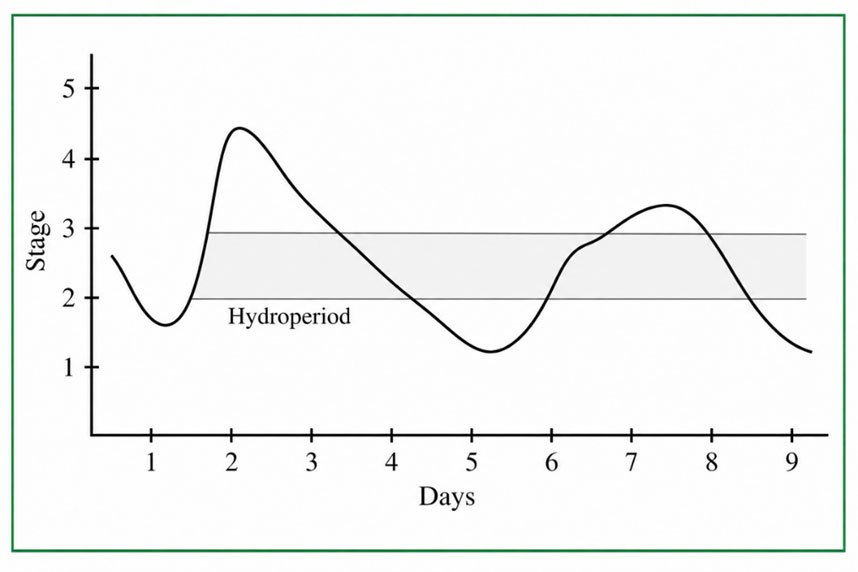
Figure 2.4.3.a: Example hydrograph of wetland water level across several days, with shaded segments showing the hydroperiod—periods when the water level (stage) remains above a specified elevation. This illustrates how hydroperiod is read from water level versus time data and why small changes in water level can substantially change the duration of inundation experienced by wetland plants and animals. (Image courtesy: Adapted from U.S. EPA (2008), Methods for Evaluating Wetland Condition: Wetland Hydrology, Figure 4. https://www.epa.gov/sites/default/files/documents/wetlands_20hydrology.pdf).
Wetland hydrology is commonly described using a water balance framework in which changes in storage reflect the balance between water inputs and outputs (Winter, 1999; Mitsch & Gosselink, 2023). A generalized wetland water balance can be expressed as:
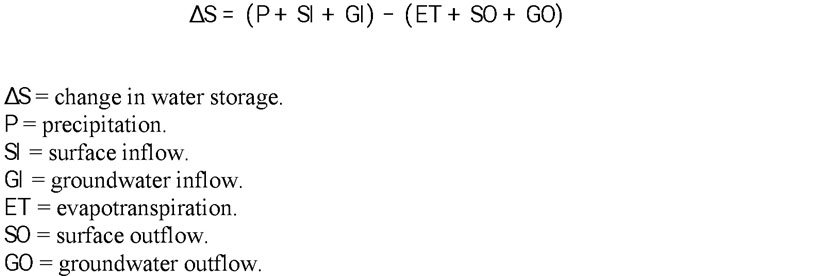
The relative importance of these components varies among wetland types and climatic regions. Ombrotrophic bogs are primarily precipitation-fed systems with limited groundwater influence, whereas riverine floodplain wetlands are strongly influenced by seasonal flood pulses. Coastal wetlands are largely regulated by tidal exchange and sea-level dynamics (Mitsch & Gosselink, 2023).
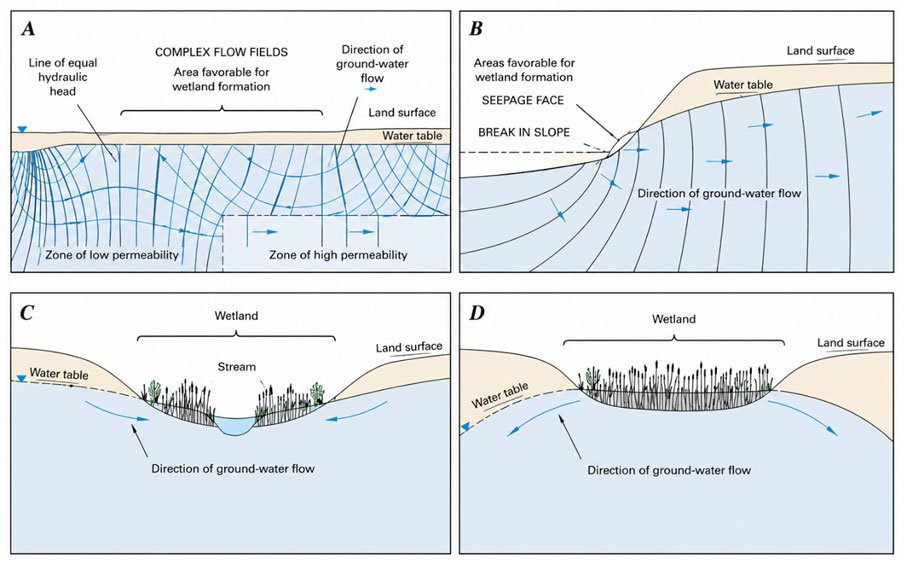
Figure 2.4.3.b: Conceptual representation of major groundwater and surface-water sources sustaining wetlands. Wetlands may receive water from (A) groundwater discharge associated with complex groundwater flow fields and contrasting permeability zones, (B) groundwater seepage at slope breaks and seepage faces, (C) interactions with streams and adjacent shallow groundwater systems, and (D) precipitation-dominated conditions where wetlands persist despite limited stream inflow and outward groundwater gradients. (Image courtesy: Adapted from U.S. Geological Survey wetland hydrology conceptshttps://pubs.usgs.gov/circ/circ1139/
Evapotranspiration is often one of the largest pathways of water loss from wetlands and is highly sensitive to vegetation structure, temperature, humidity, and solar radiation (Mitsch & Gosselink, 2023). Dense emergent macrophytes such as Phragmites australis may exhibit transpiration rates comparable to or greater than open-water evaporation because of extensive leaf area and continuous access to saturated soils (Keddy, 2010). In arid and semi-arid wetlands, evapotranspiration may consume a substantial proportion of incoming water, making wetland persistence heavily dependent on groundwater inflows and hydrological connectivity (Jolly et al., 2008). Vegetation adapted to groundwater access, including deep-rooted phreatophytes, can strongly influence wetland water balance and hydroperiod stability in dryland systems (Jolly et al., 2008).
2.4.3.1 Surface Water–Groundwater Interactions
Interactions between wetlands and groundwater are among the most important and complex aspects of wetland hydrology (Winter et al., 1998; Sophocleous, 2002). Wetlands may function as recharge wetlands, discharge wetlands, or flow-through wetlands, depending on the direction of water exchange between surface water and groundwater (Winter et al., 1998; Winter, 1999). These relationships depend on hydraulic gradients between groundwater and surface water and may vary seasonally (Sophocleous, 2002; Winter et al., 1998).
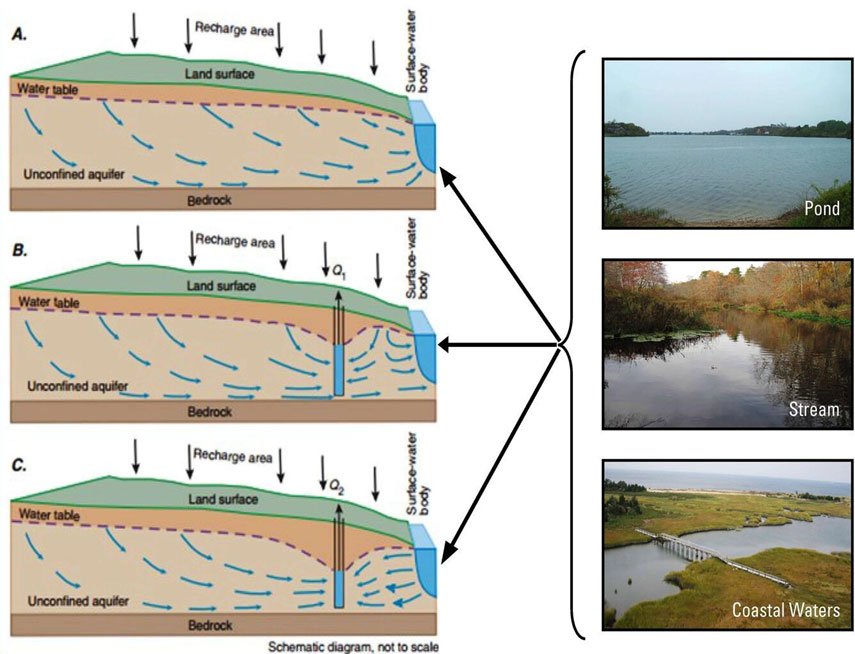
Figure 2.4.3.c: Schematic diagrams illustrating groundwater–surface water interactions, showing recharge and discharge zones in relation to surface water bodies. (Image courtesy: U.S. Geological Survey, Long Island Water Science Center. usgshttps://d9-wret.s3.us-west-2.amazonaws.com/assets/palladium/production/s3fs-public/styles/full_width/public/thumbnails/image/nyhazard2x.jpg?itok=o2QPCNOk)
Recharge wetlands contribute water to the underlying aquifers through infiltration from the wetland into groundwater systems. However, the magnitude of recharge varies substantially depending on soil permeability, geology, climate, and hydroperiod (Winter et al., 1998). Discharge wetlands receive groundwater inputs that can buffer wetlands against short-term drought conditions. Such wetlands are often highly sensitive to groundwater extraction because lowering regional water tables may reduce groundwater discharge to the wetland (Winter, 1999; Winter et al., 1998).
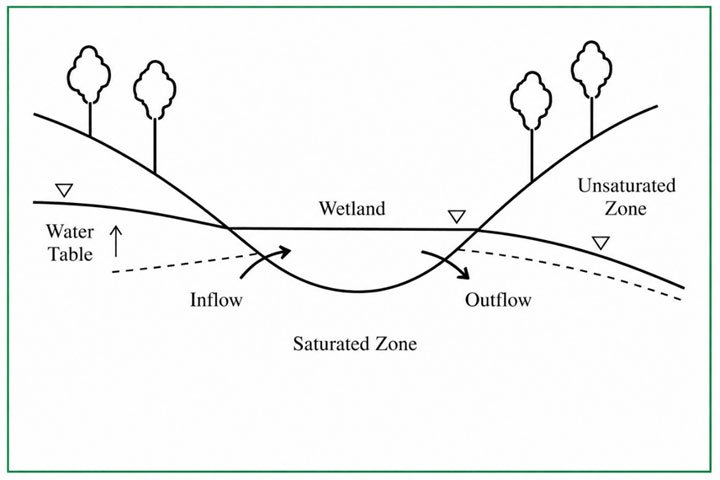
Figure 2.4.3.c: Conceptual cross‑section of a wetland and the surrounding shallow aquifer, showing groundwater flowing into the wetland on the side where the water table is higher and flowing out where the water table is lower. The saturated zone beneath the wetland and the overlying unsaturated zone are indicated to illustrate how wetlands can both receive groundwater inflows and provide groundwater recharge, depending on the local water‑table gradient. (Image courtesy: Adapted from U.S. EPA (2008), Methods for Evaluating Wetland Condition: Wetland Hydrology, Figure 9. https://www.epa.gov/sites/default/files/documents/wetlands_20hydrology.pdf).
Flow-through wetlands exhibit both recharge and discharge functions simultaneously or seasonally (Winter et al., 1998; Sophocleous, 2002). Seasonal reversals in hydraulic gradients are well documented in many floodplain and riparian wetlands (Winter et al., 1998). In arid and semi-arid environments, groundwater salinity strongly influences wetland ecology. Rising saline groundwater can lead to soil salinisation, vegetation stress, and shifts from freshwater to saline wetland communities. This process has been documented in Australian dryland wetlands, where altered groundwater regimes and salinisation have degraded wetland condition (Jolly et al., 2008).
2.4.3.2 Role of Wetlands in Flow Regulation
Wetlands perform important hydrological functions by temporarily storing and gradually releasing water during and after precipitation events (Bullock & Acreman, 2003; Winter, 1999). Floodplain wetlands, marshes, and riparian wetlands can reduce downstream flood peaks by intercepting runoff and slowing water movement through storage and increased hydraulic resistance (Bullock & Acreman, 2003). The extent of flood attenuation provided by wetlands depends on wetland size, connectivity, antecedent saturation, landscape position, and storm intensity (Bullock & Acreman, 2003). Although increased wetland area is often associated with reduced flood peaks, the relationship is context-dependent and should not be generalised without watershed-specific evidence (Bullock & Acreman, 2003).
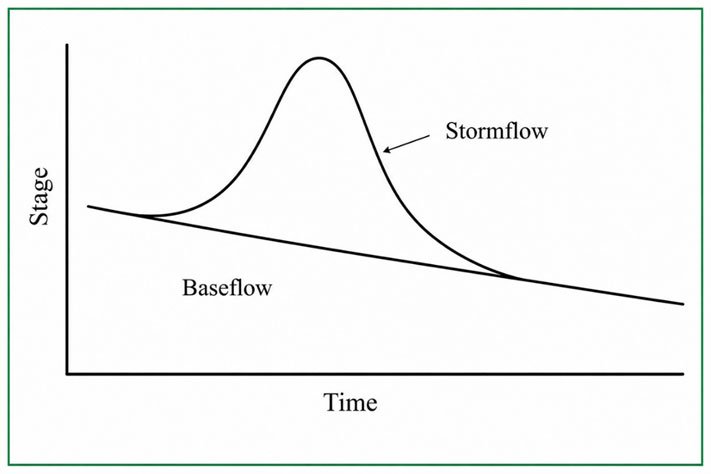
Figure 2.4.3.d: Conceptual hydrograph of wetland water level over time, showing gradually declining background flow (baseflow) and the sharp rise and fall in water level associated with a single storm event (stormflow). Here, water level (also called stage) is plotted against time to illustrate how storms temporarily raise wetland and stream levels above their normal baseflow condition. (Image courtesy: Adapted from U.S. EPA (2008), Methods for Evaluating Wetland Condition: Wetland Hydrology, Figure 11. https://www.epa.gov/sites/default/files/documents/wetlands_20hydrology.pdf).
Wetlands also contribute to baseflow maintenance by slowly releasing stored water to streams and rivers during dry periods (Winter, 1999; Winter et al., 1998). This function helps stabilise streamflow, sustain aquatic ecosystems, dilute pollutants, and maintain water quality during low-flow conditions (Winter, 1999). Watersheds with extensive wetland loss often exhibit flashier hydrological responses characterised by rapid runoff peaks and reduced dry-season flows (Bullock & Acreman, 2003; Winter, 1999).
Case Study: Indonesian Mangrove Wetland Restoration
An example of hydrology-driven wetland recovery comes from North Kalimantan, Indonesia, where ecological mangrove restoration has been used in abandoned fishponds (Wetlands International, 2024). The project showed that restoring tidal hydrology by improving water exchange and reconnecting blocked flows enabled natural mangrove regeneration rather than relying only on tree planting (Wetlands International, 2024). This case suggests that in mangrove wetlands, hydrology is often the key factor determining whether restoration succeeds or fails (Wetlands International, 2024). It is therefore a strong example of how water movement, salinity, and tidal connectivity shape wetland structure and recovery in tropical Asia (Wetlands International, 2024).
Case Study: Flood Damage Reduction by Wetlands: Evidence from the Charles River, USA
The US Army Corps of Engineers conducted a landmark economic study of the Charles River basin in Massachusetts, demonstrating that the natural wetlands of the basin provided flood storage and damage reduction services valued at over US$17 million per year (at 1970s values). The study calculated that replacing the flood storage capacity of those wetlands with engineered detention infrastructure would cost US$5,000–8,000 per acre. This became one of the first and most cited economic cases for wetland conservation, establishing the principle that preserving a wetland is often cheaper than engineering around its absence. The study influenced the US Clean Water Act Section 404 programme for wetland protection and remains a landmark in environmental economics. (Source: Larson, J.S., 1976; US Army Corps of Engineers, New England Division)
Task for Students
Consider a watershed or river basin in your region. Has wetland drainage affected the flood behaviour of streams or rivers? Using any available hydrological records, newspaper reports, policy documents, or your own observation, describe the evidence or lack thereof for hydrological change following wetland loss. Post in Forum W-001.
Watch the Video
Watch the Video
This video explains how wetlands function as recharge, discharge, and flow-through systems within the broader groundwater cycle. (Courtesy: Wetland Water Cycle Overview / YouTube)
The video talks about hydrologic functions and values of wetlands and watercourses, including their importance in the "water cycle", for recharging groundwater, and for assuring a clean water supply.
References
Bullock, A., & Acreman, M. (2003). The role of wetlands in the hydrological cycle. Hydrology
and Earth System Sciences, 7(3), 358–389. https://doi.org/10.5194/hess-7-358-2003
Jolly, I. D., McEwan, K. L., & Holland, K. L. (2008). A review of groundwater-surface water
interactions in arid/semi-arid wetlands and the consequences of salinity for wetland ecology. Ecohydrology, 1(1), 43–58. https://doi.org/10.1002/eco.6
Keddy, P. A. (2010). Wetland ecology: Principles and conservation (2nd ed.). Cambridge
University Press. https://doi.org/10.1017/CBO9780511778179
Larson, J. S. (Ed.). (1976). Models for assessment of freshwater wetlands (Publication No. 32).
University of Massachusetts, Amherst. https://www.epa.gov/system/files/documents/2025-12/report-on-an-overview-of-major-wetland-fundtions-and-values-1984-fws.pdf
Mitsch, W. J., & Gosselink, J. G. (2023). Wetlands (6th ed.). Wiley.
https://www.wiley.com/en-us/Wetlands,+6th+Edition-p-00354180
Sophocleous, M. (2002). Interactions between groundwater and surface water: The state of the
science. Hydrogeology Journal, 10(1), 52–67. https://doi.org/10.1007/s10040-001-0170-8
Winter, T. C. (1999). Relation of streams, lakes, and wetlands to groundwater flow
systems. Hydrogeology Journal, 7(1), 28–45. https://doi.org/10.1007/s100400050178
Winter, T. C., Harvey, J. W., Franke, O. L., & Alley, W. M. (1998). Groundwater and surface
water: A single resource. U.S. Geological Survey Circular 1139. https://pubs.usgs.gov/circ/circ1139/
Wetlands International. (2024). Demonstrating and upscaling ecological mangrove restoration in
North Kalimantan, Indonesia. https://www.wetlands.org/case-study/demonstrating-and-upscaling-ecological-mangrove-restoration-in-north-kalimantan-indonesia/
2.4.4 Wetlands and Water Quality
The water quality functions of wetlands are among their most widely studied and practically applied ecological attributes. When water flows through a wetland system, it undergoes a combination of physical, chemical, and biological processes that collectively remove, transform, or immobilise a wide range of contaminants, including suspended sediments, nutrients (particularly nitrogen and phosphorus), heavy metals, organic pollutants, and pathogens. This functional capacity is now sufficiently well understood that both natural and constructed wetlands are increasingly incorporated into integrated water management frameworks as nature-based solutions for the treatment of agricultural runoff, urban stormwater, and secondary wastewater (Vymazal, 2023).
The physical mechanism underpinning many water quality functions is relatively straightforward but highly effective: wetlands reduce the velocity of flowing water. As hydraulic flow velocity decreases upon entering a wetland, the carrying capacity of water for suspended particles declines, allowing sediments to settle through gravitational deposition. This sedimentation process not only reduces turbidity but also removes many particle-bound contaminants, including phosphorus, trace metals, and hydrophobic organic pollutants. The effectiveness of sediment trapping depends strongly on hydraulic residence time, flow-path geometry, microtopography, and the density of emergent vegetation, which further slows and redistributes water movement. Studies indicate that appropriately functioning wetland systems can retain between 60% and 90% of incoming suspended sediments under suitable hydrological conditions (Tanner et al., 2008; Tong & Chen, 2020).
Beyond sedimentation, wetland ecosystems support a range of chemical and microbial transformations capable of permanently removing contaminants from the aquatic environment rather than merely storing them temporarily. This distinction between retention and removal is particularly important in wetland management. Retained phosphorus, for example, may later be remobilised during anoxic conditions or following hydrological disturbance, whereas denitrified nitrogen is permanently removed from the aquatic system through conversion to atmospheric N₂ gas.
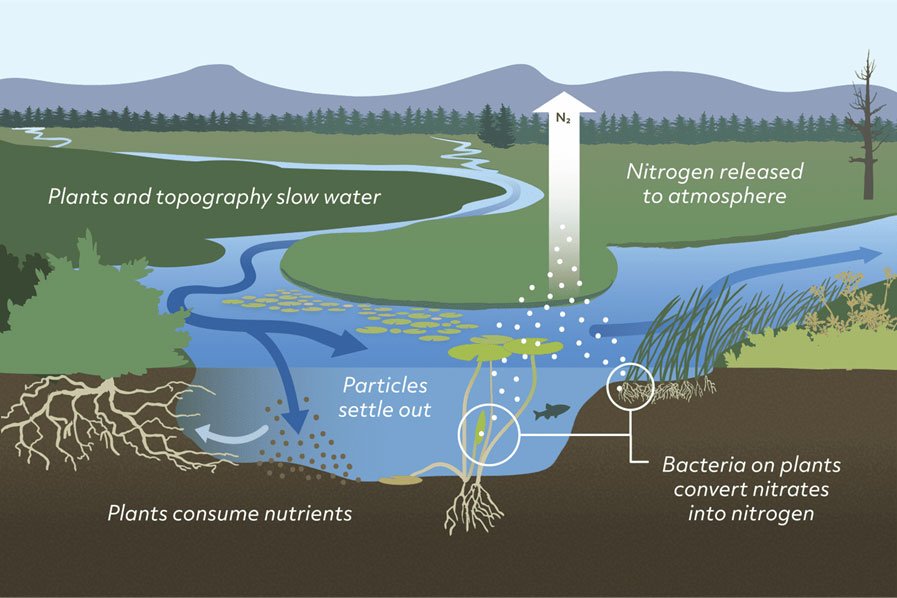
Figure 2.4.1.d. Conceptual illustration of wetland nutrient removal, showing how slow water flow, sediment settling, plant uptake, and bacterial denitrification convert nitrate to nitrogen gas released to the atmosphere. (Image courtesy: AskNature, Interacting Organisms Remove Nutrients. https://asknature.org/strategy/interacting-organisms-remove-nutrient.)
Consequently, wetlands managed for nitrogen removal require different hydrological and biogeochemical conditions from those intended primarily for phosphorus retention. In many developing regions of Asia and Africa, wetlands also function as critical natural water purification systems under conditions of rapid urbanisation, limited wastewater infrastructure, and intensive agricultural expansion. Monsoon-driven floodplain wetlands, mangrove systems, shallow lakes, and urban peri-urban marshes frequently receive untreated domestic sewage, sediment-rich runoff, and nutrient inputs from surrounding catchments. Despite these pressures, such ecosystems often continue to regulate water quality through sediment trapping, nutrient uptake, microbial transformation, and hydrological buffering. The East Kolkata Wetlands provide one of the most widely documented examples of wastewater-fed wetland management, where sewage-derived nutrients are naturally processed through integrated fisheries and wetland-based treatment systems that simultaneously support livelihoods and urban waste recycling (Dey & Banerjee, 2013; Saha et al., 2021).
Nutrient Cycling, Pollutant Retention, and Sediment Trapping
Nitrogen dynamics within wetlands involve several interconnected microbial and biogeochemical pathways. Ammonium (NH₄⁺) generated through organic matter decomposition may undergo nitrification in aerobic microsites, particularly near sediment surfaces and plant root zones, producing nitrate (NO₃⁻). This nitrate subsequently diffuses into anaerobic zones where denitrifying bacteria convert it into gaseous nitrogen (N₂), thereby permanently removing nitrogen from the aquatic system. This coupled nitrification–denitrification pathway represents the dominant long-term nitrogen removal mechanism in many wetland environments. Additional nitrogen removal occurs through plant uptake and biomass accumulation, although a substantial proportion is later returned to the system during decomposition. Longer-term storage may occur through peat formation and burial of organic nitrogen within accumulating sediments. Syntheses of wetland nutrient studies suggest that natural wetland systems may remove approximately 35–77% of incoming total nitrogen under variable hydrological and temperature conditions, depending on hydrological loading, temperature, vegetation type, and wetland morphology (Tanner et al., 2008; Vymazal, 2023).
Phosphorus retention in wetlands occurs primarily through sorption onto iron and aluminium oxides within mineral soils, a process generally more effective in mineral-rich alluvial wetlands than in peat-dominated systems where sorption sites are comparatively limited (Reddy & DeLaune, 2008; Richardson, 1985). Vegetation temporarily stores phosphorus through biomass uptake; however, much of this phosphorus eventually re-enters the system during litter decomposition unless plant material is harvested (Mitsch & Gosselink, 2023). Longer-term phosphorus sequestration occurs through sediment accretion and burial, although stored phosphorus may still be released under reducing conditions, sediment disturbance, or prolonged flooding, a process well documented in lake sediments and analogous to wetland internal loading (Nürnberg, 1984; Reddy & DeLaune, 2008).
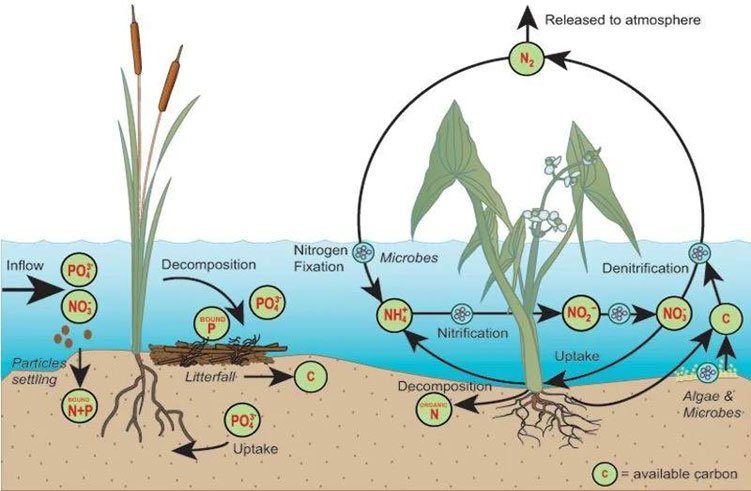
Figure 2.4.4.e: A simplified illustration of the nitrogen and phosphorus cycles in a wetland (Image courtesy https://upload.wikimedia.org/wikipedia/commons/e/e0/A_simplified_illustration_of_the_nitrogen_and_phosphorus_cycles_in_a_wetland.jpg?_=20190321161357
The implications of phosphorus saturation are especially significant in intensively cultivated and densely populated regions. Wetlands receiving chronically elevated phosphorus inputs may gradually transition from net nutrient sinks to nutrient sources once sorption capacity becomes exhausted (Kadlec & Wallace, 2009; Richardson, 1985). This phenomenon has been extensively documented in the Florida Everglades, where long-term agricultural drainage altered soil chemistry, nutrient status, and vegetation composition (Noe et al., 2001; U.S. Geological Survey, 2006). Comparable processes are increasingly observed in tropical and subtropical wetlands across Asia and Africa. In the East Kolkata Wetlands, phosphorus dynamics play a central role in maintaining wastewater purification efficiency while preventing excessive eutrophication within sewage-fed fisheries (Basu et al., 2016). Similarly, seasonally inundated floodplain wetlands associated with the Inner Niger Delta and the Okavango Delta regulate nutrient and sediment transport across large hydrological gradients, thereby supporting downstream water quality, fisheries productivity, and floodplain agriculture under highly variable climatic conditions (Wetlands International, 2024).
Wetlands also contribute substantially to sediment retention in monsoon-dominated river basins and tropical floodplains. During seasonal flooding, densely vegetated marshes and floodplain depressions reduce water velocity and promote deposition of suspended sediments and associated nutrients. Such processes are particularly important in highly sediment-laden systems influenced by agricultural erosion and catchment disturbance. In South and Southeast Asia, floodplain wetlands associated with the Sundarbans and Tonlé Sap help regulate sediment redistribution, nutrient exchange, and estuarine water quality under strongly seasonal hydrological regimes (Dutta et al., 2017; Poole et al., 2014). These wetlands therefore perform not only ecological functions but also critical socio-economic roles by supporting fisheries, agriculture, and flood regulation in densely populated landscapes.
Task for Students
Non-point source (diffuse) pollution from agriculture, particularly nitrogen and phosphorus from fertilizers as one of the most difficult water quality problems to manage using https://youtu.be/spErZf-LZ3I, and identify the conditions under which this solution would be most and least effective. Post in Forum W-001.
Watch the Video
The East Kolkata Wetlands constitute a multifunctional peri-urban wetland system that sustains local livelihoods, provides natural wastewater filtration and flood attenuation, and remains increasingly vulnerable to urban expansion.
References
Basu, S., Ghosh, A., Hazra, S., & Naskar, K. (2016). Phosphorous dynamics of the aquatic
system constitutes an important axis for waste water purification in natural treatment pond(s) in East Kolkata Wetlands. Ecological Engineering, 90, 424–432. https://doi.org/10.1016/j.ecoleng.2016.01.056
Dey, D., & Banerjee, S. (2013). Ecosystem and livelihood support: The story of East Kolkata
Wetlands. Environment and Urbanization ASIA, 4(2), 325–337. https://doi.org/10.1177/0975425313511158
Dutta, M. K., Bianchi, T. S., & Mukhopadhyay, S. K. (2017). Sources and dynamics of
sedimentary organic matter in Sundarban mangrove estuary from Indo-Gangetic delta. Ecological Processes, 6(1), 8. https://doi.org/10.1186/s13717-017-0076-6
Kadlec, R. H., & Wallace, S. D. (2009). Treatment wetlands (2nd ed.). CRC
Press. https://doi.org/10.1201/9781420012514
Mitsch, W. J., & Gosselink, J. G. (2023). Wetlands (6th ed.). Wiley.
https://www.wiley.com/en-us/Wetlands,+6th+Edition-p-00354180
Noe, G. B., Childers, D. L., & Jones, R. D. (2001). Phosphorus biogeochemistry and the impact
of phosphorus enrichment: Why is the Everglades so unique? Ecosystems, 4(7), 603–624. https://doi.org/10.1007/s10021-001-0032-1
Nürnberg, G. K. (1984). The prediction of internal phosphorus load in lakes with anoxic
hypolimnia. Limnology and Oceanography, 29(1), 111–124. https://doi.org/10.4319/lo.1984.29.1.0111
Poole, C. M., Hoxha, A., Freitas, R., & Giles-Vernick, T. (2014). Modelling future changes of
habitat and fauna in the Tonle Sap Lake floodplain. Environmental Conservation, 41(2), 167–179. https://doi.org/10.1017/S0376892913000477
Reddy, K. R., & DeLaune, R. D. (2008). Biogeochemistry of wetlands: Science and applications.
CRC Press. https://doi.org/10.1201/9780203491454
Richardson, C. J. (1985). Mechanisms controlling phosphorus retention capacity in freshwater
wetlands. Science, 228(4706), 1424–1427. https://doi.org/10.1126/science.228.4706.1424
Saha, M., Sarkar, A., & Bandyopadhyay, B. (2021). Water quality assessment of East Kolkata
Wetland with a special focus on bioremediation by nitrifying bacteria. Water Science and Technology, 84(10–11), 2718–2736. https://doi.org/10.2166/wst.2021.223
Tanner, C. C., D'Eugenio, J., McBride, G. B., Sukias, J. P. S., & Thompson, K. (2008). Efficacy
of natural wetlands to retain nutrient, sediment, and microbial pollutants. Journal of Environmental Quality, 37(2), 474–483. https://doi.org/10.2134/jeq2007.0067
Tong, S. T. Y., & Chen, W. (2020). Sediment and nutrient retention capacity of natural riverine
wetlands. Frontiers in Environmental Science, 8, 122. https://doi.org/10.3389/fenvs.2020.00122
U.S. Geological Survey. (2006). Phosphorus budgets in Everglades wetland ecosystems (Open-
File Report 2006-1274). U.S. Department of the Interior. https://pubs.usgs.gov/publication/70029730
Vymazal, J. (2023). Wetlands as nature-based solutions for water management in different
environments. Current Opinion in Environmental Science & Health, 33, 100476. https://doi.org/10.1016/j.coesh.2023.100476
Wetlands International. (2024). Wetlands for peace: The Inner Niger
Delta. https://www.wetlands.org/blog/wetlands-for-peace-the-inner-niger-delta/
2.4.5. Wetland Inventory, Classification, and Mapping
Effective wetland management begins with knowing where wetlands are, what type they are, and how they are changing over time. Wetland inventory, the systematic documentation of wetland extent, type, condition, and ecological character, is the foundational information layer for any management or conservation program. Without a reliable inventory, it is impossible to assess rates of loss, identify priorities for protection, evaluate the adequacy of the protected area network, or report against international obligations such as the Ramsar Convention (Ramsar Convention Secretariat, 2002; Global Wetland Outlook, 2018). Yet despite its importance, comprehensive national wetland inventories remain absent or outdated in many countries, particularly in the Global South as of Ramsar COP8, fewer than 30 of the Convention's Contracting Parties had completed comprehensive national inventories (Ramsar Convention Secretariat, 2002).
National and regional inventories typically follow a hierarchical classification approach. In the United States, the Cowardin et al. (1979) system adopted by the National Wetland Inventory organises wetlands into five broad systems (marine, estuarine, lacustrine, riverine, and palustrine), progressively refining to subsystem, class based on water regime, subclass based on vegetation form, and special modifiers for water chemistry, soil type, and disturbance (Cowardin et al., 1979). The Ramsar Convention uses a parallel but distinct framework of 42 wetland types across marine/coastal, inland, and human-made categories (Ramsar Convention Secretariat, 2002). Both systems ensure that inventory data is compatible with international reporting frameworks while retaining the resolution needed for local management. The US National Wetland Inventory (NWI), Australia's National Wetland Map, and Canada's Wetland Classification System are among the most developed national inventory examples, providing publicly accessible, periodically updated spatial databases (Cowardin et al., 1979; National Wetlands Working Group, 1997).
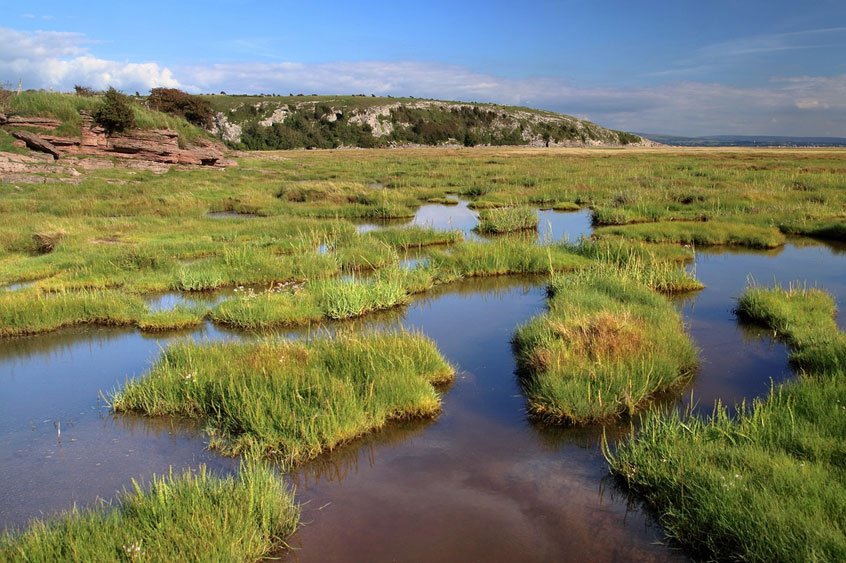
Figure 2.4.5.a: coastal marsh wetland with shallow standing water and emergent grasses, illustrating a marsh-type wetland ecosystem and its mosaic of water and vegetation. (Image courtesy: pixabay.com,https://pixabay.com/images/download/emphyrio-salt-marsh-5549537_1920.jpg)
It is important to note that inventory maps such as the NWI are based on remote sensing and vegetation interpretation and are not intended as legal determinations of wetland boundaries; site-specific regulatory delineation requires on-the-ground field verification (USFWS, 2024). Many developing nations are now building comparable inventory systems using cost-effective satellite remote sensing, supported by international guidance such as the Ramsar Convention's National Wetland Inventory Toolkit (Ramsar Convention Secretariat, 2020).
Mapping accuracy is a critical consideration that is often underappreciated. Wetland boundaries are inherently transitional; they shift gradually into upland or aquatic systems, and their spatial extent varies seasonally with hydroperiod. Field-validated accuracy assessments are essential to understand map reliability. Studies using object-based image classification (OBIC) of multispectral satellite imagery have reported overall accuracies of 84–94% for major wetland types, but accuracy declines substantially for wetland subtypes, particularly in densely vegetated, heterogeneous, or seasonally dynamic systems (Mahdianpari et al., 2017; Whiteside & Franklin, 2017). Combined use of LiDAR and multispectral imagery can achieve higher accuracies of 92–98% for wetlands above minimum mapping units (Tiner et al., 2015; Laba et al., 2010). Map users, whether ecologists, planners, or legal practitioners, need to understand these limitations and treat inventory maps as probabilistic representations of wetland distribution rather than precise or legally binding boundaries (USFWS, 2024).
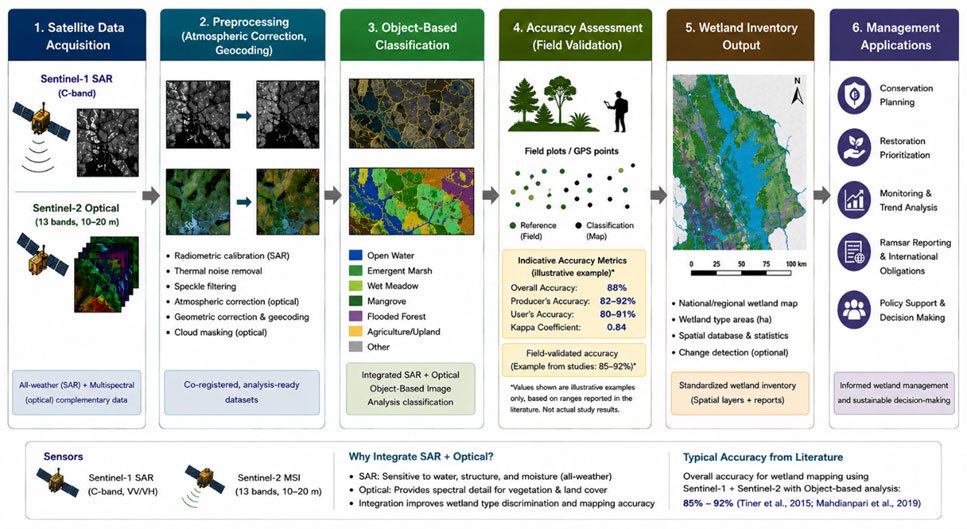
Figure 2.4.5. b: Remote sensing workflow for national and regional wetland inventory mapping, illustrating the integration of Sentinel-1 SAR (C-band) and Sentinel-2 MSI (multispectral) imagery through six sequential stages: satellite data acquisition, preprocessing, object-based image analysis (OBIA) classification, field-validated accuracy assessment, wetland inventory output, and management applications. Indicative accuracy metrics (Overall Accuracy: 85–92%; Kappa: ~0.84) are drawn from published Sentinel-based wetland mapping studies. (Image courtesy: Syeda Tabassum Tasfia. Original schematic with conceptual framework and accuracy metrics adapted from Mahdianpari et al. (2019) and Tiner et al. (2015).)
2.4.5.1 Overview of Remote Sensing and GIS Applications
Remote sensing has transformed wetland mapping over the past three decades, enabling large-area, time-series analysis that was previously impossible with field-based methods alone (Tiner et al., 2015). Optical multispectral sensors such as Landsat and Sentinel-2 exploit the spectral signatures of hydrophytic vegetation and open water to delineate wetland extent; near-infrared (NIR) and shortwave infrared (SWIR) bands are particularly sensitive to vegetation water content and soil moisture (Mahdianpari et al., 2017). However, dense vegetation canopies can obscure the soil surface from optical sensors, making it difficult to detect wetlands with closed canopies or to distinguish wet from dry conditions under heavy cloud cover, a significant limitation in tropical and boreal regions (Hess et al., 2003; Mahdianpari et al., 2018).
Synthetic Aperture Radar (SAR) has emerged as a powerful complement to optical imagery for wetland detection, because it operates independently of cloud cover and solar illumination (Tiner et al., 2015). The freely available Sentinel-1 C-band SAR is widely used for detecting surface inundation in open water, emergent marshes, and sparsely vegetated wetlands. However, it is important to note that C-band SAR has limited capacity to penetrate dense forest canopies; detection of inundation beneath dense tropical swamp forest or closed-canopy boreal wetlands generally requires longer-wavelength L-band SAR systems such as ALOS-2 PALSAR, which can achieve greater canopy penetration (Hess et al., 2003; Bourgeau-Chavez et al., 2017; Tsyganskaya et al., 2018). The combination of Sentinel-1 SAR and Sentinel-2 multispectral data has nonetheless become a widely adopted approach in national and global wetland mapping programs, enabling mapping at 10–30 m spatial resolution with near-real-time temporal frequency (Mahdianpari et al., 2019; Adeli et al., 2020; Tamiminia et al., 2022).
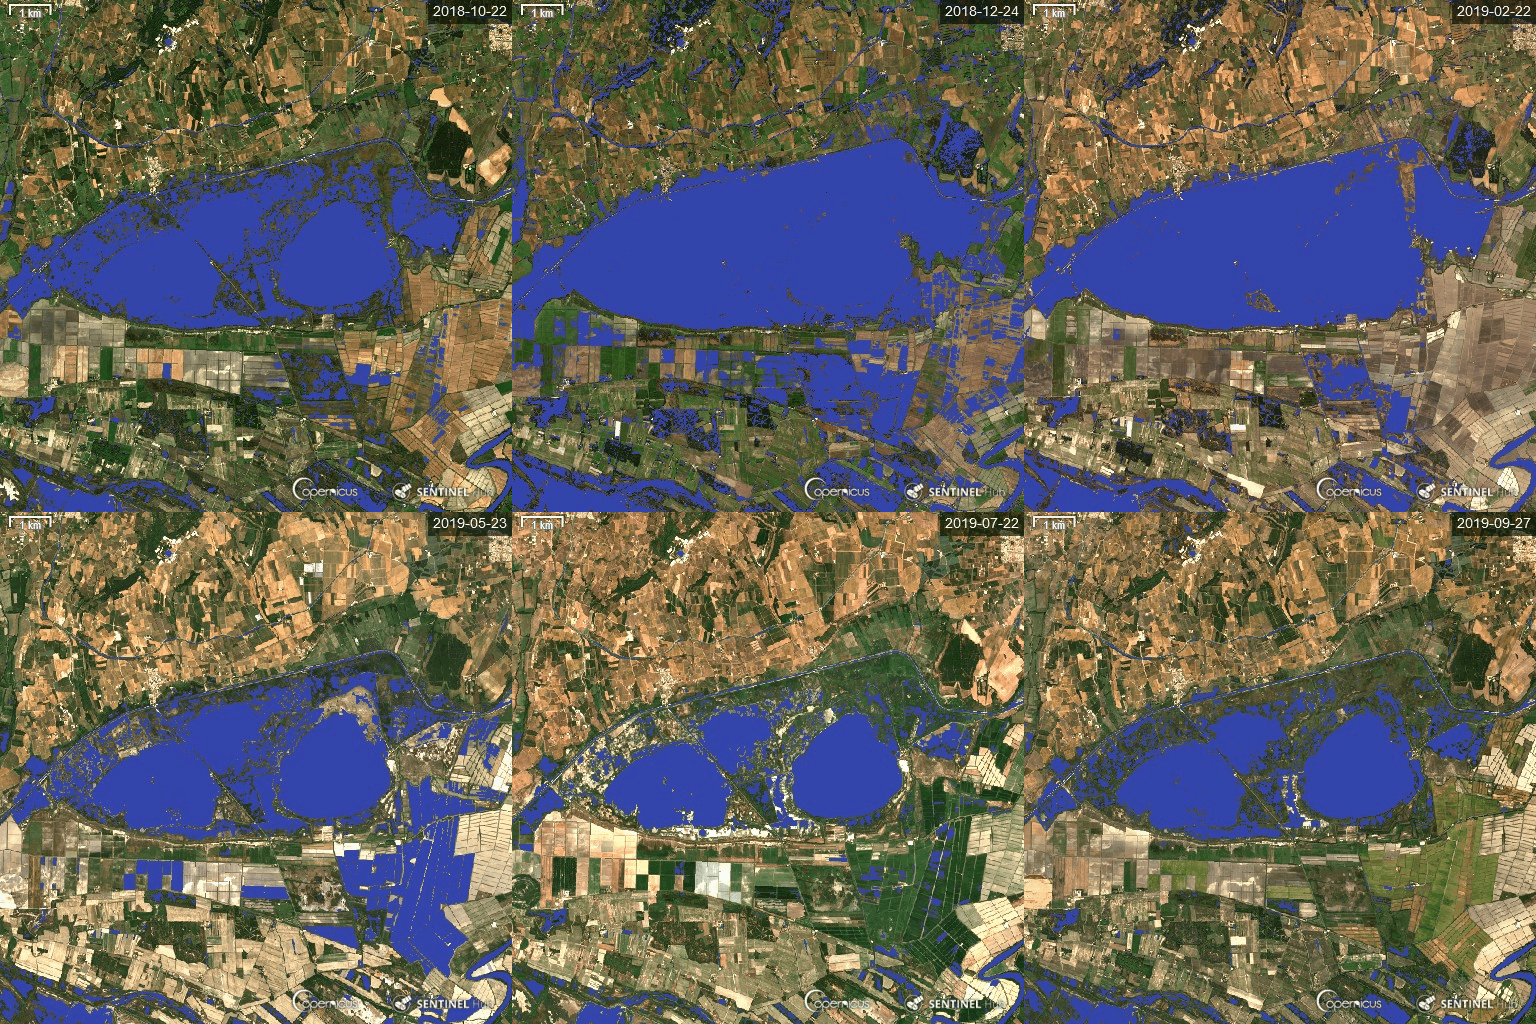
Figure 2.4.5.1. Sentinel-2 satellite time-lapse showing monthly changes in surface water in a reed-marsh wetland in the Camargue, southern France (2018–2019). (Image courtesy: Lefebvre et al., Sentinel Hub wetland water-mapping script. https://custom-scripts.sentinel-hub.com/custom-scripts/sentinel-2/wiw_s2_script/fig/timelapse_chasca_12images_sent2.gif)
GIS analysis is essential for translating wetland maps into management information. Spatial overlay of wetland layers with land use, soil type, hydrology, and drainage networks allows analysts to assess landscape connectivity, identify wetland complexes that function as integrated hydrological units, model the downstream water quality and flood attenuation benefits provided by specific wetland areas, and prioritise areas for conservation investment based on multi-criteria analysis (Brinson & Malvárez, 2002). GIS-based wetland functional assessment methods, such as the Hydrogeomorphic (HGM) Approach developed by Brinson (1993), move beyond extent mapping to evaluate the functional condition of each wetland relative to reference standards. The HGM approach classifies wetlands into seven classes based on geomorphic position and hydrological characteristics and uses field-calibrated functional indices (scaled 0–1) to assess how well a wetland is performing relative to its natural reference state, providing the information base for condition assessment, restoration prioritisation, and mitigation planning (Brinson, 1993; Smith et al., 1995).
2.4.5.2 Wetland Management Planning Approaches
Management planning translates inventory and assessment information into a practical, strategic framework for protecting, managing, and restoring wetland values. Think of it as the "action plan" that turns scientific knowledge about a wetland into on-the-ground decisions. The Ramsar Convention's "wise use" principle, formally defined at the Convention's third meeting of parties (COP3) in 1987, and further refined at COP9 in 2005, establishes the overarching objective of wetland management as "the maintenance of ecological character, achieved through the implementation of ecosystem approaches, within the context of sustainable development" (Ramsar Convention Secretariat, 2005; 2007). In simple terms, this means wetlands should be managed so that they keep working the way nature intended, even while people continue to use them. This principle recognises that wetlands can and should continue to support human uses such as fisheries, water supply, tourism, and grazing, but only within the limits that preserve their ecological functioning (Ramsar Convention Secretariat, 2007).
A wetland management plan typically includes five core components: (1) a description of the ecological character of the wetland, its biological components, hydrological processes, and ecosystem services; (2) a statement of management objectives aligned with both conservation status and human use requirements; (3) identification of key threats and their underlying drivers; (4) specific management actions and programs to address those threats; and (5) a monitoring and evaluation framework to track progress and adapt management over time (Ramsar Convention Secretariat, 2002; Hails, 1997). The Ramsar Secretariat's New Guidelines for Management Planning for Ramsar Sites and other wetlands, adopted at COP8 as Resolution VIII.14 (2002)provide a widely used template for this five-part structure (Ramsar Convention Secretariat, 2002). However, effective plans must always be highly site-specific and developed through participatory processes involving local communities, landholders, and other stakeholders, since top-down plans without local buy-in consistently underperform (Barbier et al., 1997; Mitsch & Gosselink, 2023).
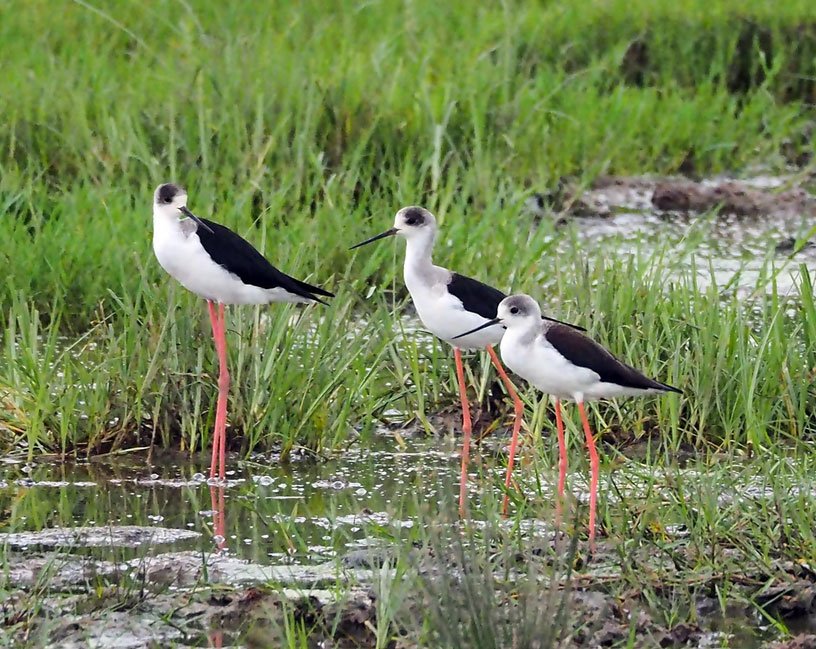
Figure 2.4.5.2: Black-winged stilt, one of the many water birds that form part of a wetland’s biological components and ecological character. (Image courtesy: vinsky2002https://pixabay.com/)
A critical and often contested element of management planning is the delineation of wetland buffers: vegetated upland zones surrounding wetlands within which land use is restricted or regulated to protect the wetland from direct and indirect impacts such as pesticide drift, nutrient runoff, and physical encroachment. To use an everyday analogy, a buffer zone works like a filter and a fence; it slows and cleans runoff before it reaches the wetland, and keeps damaging activities at a safe distance. Buffer width recommendations vary considerably in the scientific literature: a minimum of 15–30 m is generally considered necessary to protect the basic physical and chemical characteristics of a wetland under typical conditions; widths of 30–100 m are required for effective nitrogen and phosphorus removal from agricultural runoff; and widths of 100–300 m or more may be required to meet the breeding habitat and movement corridor needs of sensitive wildlife species (Castelle et al., 1994; Mayer et al., 2007; Houlahan & Findlay, 2004). Fixed-width buffers are administratively simpler but do not account for slope, soil permeability, land use intensity, or species-specific requirements; variable-width, science-based buffers are more ecologically effective but are more complex to regulate and enforce (Castelle et al., 1994; USACE, 2005).
The scientific basis for buffer design ultimately requires integrating hydrological transport modelling to determine how far agricultural runoff travels before reaching the wetland with ecological requirements such as breeding territories and movement corridors, and with social constraints including landowner agreements and economic impacts (Barbier et al., 1997; Mitsch & Gosselink, 2023). This integration of hydrology, ecology, and social science makes wetland management planning an inherently interdisciplinary exercise and one of the most intellectually demanding challenges in applied conservation.
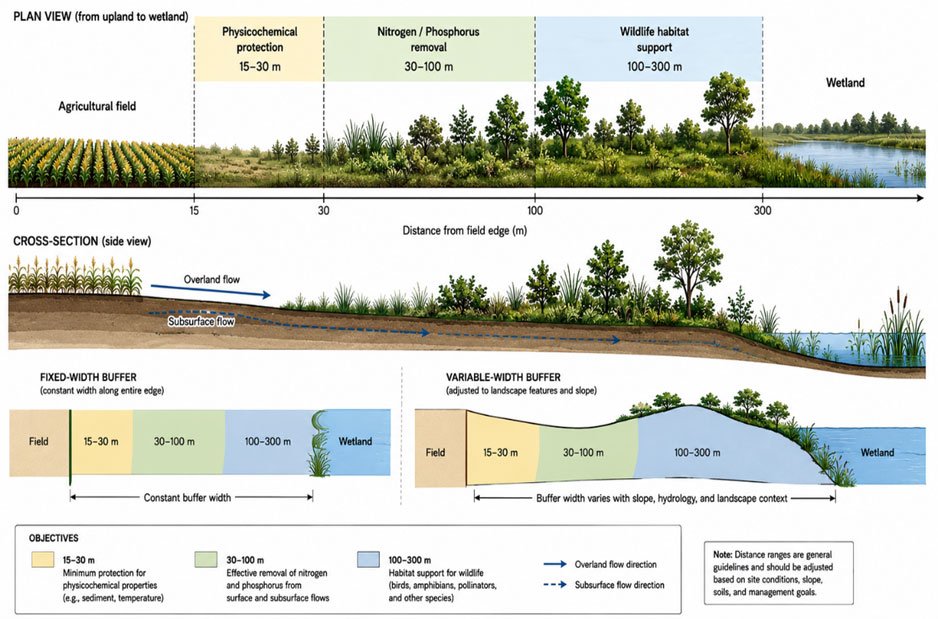
Figure 2.4.5.b: Conceptual representation of wetland buffer zone width requirements for three protection objectives, shown in plain view and cross-section: Zone 1 (15–30 m) provides minimum physicochemical protection including sediment filtration and pesticide interception; Zone 2 (30–100 m) enables effective nitrogen and phosphorus removal from surface and subsurface flows; Zone 3 (100–300 m) supports wildlife habitat for birds, amphibians, and pollinators. The lower panels compare fixed-width (constant along the field edge) and variable-width (adjusted to slope, hydrology, and landscape context) buffer approaches. Distance ranges are general guidelines; site-specific conditions determine appropriate widths. (Image courtesy: Syeda Tabassum Tasfia. Original schematic with adaptation of the conceptual framework adapted from Castelle et al. (1994) and Mayer et al. (2007).)
Task for Students
Access the Ramsar Information Service (https://rsis.ramsar.org/) and examine the management plan (or Information Sheet) of a Ramsar site in or near your country. Evaluate: Does the plan include a monitoring program? How are threats identified and addressed? What role do local communities play in the plan? Share your assessment in Forum W-001.
Watch the Video: A look at Ramsar Convention's plan to protect wetlands
Mandatory Quiz: [Click Here]
References
Adeli, S., Salehi, B., Mahdianpari, M., Quackenbush, L., Brisco, B., Tamiminia, H., & Shaw, S.
(2020). Wetland monitoring using SAR data: A meta-analysis and comprehensive review. Remote Sensing, 12(14), 2190. (2020). Wetland monitoring using SAR data: A meta-analysis and comprehensive review. Remote Sensing, 12(14), 2190. https://doi.org/10.3390/rs12142190
Barbier, E. B., Acreman, M., & Knowler, D. (1997). Economic valuation of wetlands: A guide
for policy makers and planners. Ramsar Convention Bureau. https://www.ramsar.org/sites/default/files/documents/library/valuation_e.pdf
Bourgeau-Chavez, L., Endres, S., Battaglia, M., Miller, M. E., Murray, K., Quackenbush, L., &
Stavros, N. (2017). Development of a bi-national Great Lakes coastal wetland and land use map using three-season PALSAR and Landsat imagery. Remote Sensing, 9(2), 129. https://doi.org/10.3390/rs9020129
Brinson, M. M. (1993). A hydrogeomorphic classification for wetlands (Technical Report WRP-
DE-4). U.S. Army Corps of Engineers. https://wetlands.el.erdc.dren.mil/pdfs/wrpde4.pdf
Brinson, M. M., & Malvarez, A. I. (2002). Temperate freshwater wetlands: Types, status, and
threats. Environmental Conservation, 29(2), 115-133. https://doi.org/10.1017/S0376892902000085
Castelle, A. J., Johnson, A. W., & Conolly, C. (1994). Wetland and stream buffer size
requirements - A review. Journal of Environmental Quality, 23(5), 878-882. https://doi.org/10.2134/jeq1994.00472425002300050004x
Cowardin, L. M., Carter, V., Golet, F. C., & LaRoe, E. T. (1979). Classification of wetlands and
deepwater habitats of the United States (FWS/OBS-79/31). U.S. Fish and Wildlife Service. https://www.fws.gov/wetlands/Documents/Classification-of-Wetlands-and-Deepwater-Habitats-of-the-United-States.pdf
Ecosystem Marketplace. (2005). Setting buffer sizes for wetlands. Ecosystem Marketplace.
https://www.ecosystemmarketplace.com/wp-content/uploads/archive/documents/Doc_456.pdf
Environmental Law Institute / San Francisco Estuary Institute. (2023). Overview of wetland
remote sensing technologies. https://www.eli.org/sites/default/files/files-pdf/1.%20Overview%20of%20Wetland%20Remote%20Sensing%20Technologies.pdf
Global Wetland Outlook. (2018). Global wetland outlook: State of the world's wetlands and their
services to people and nature. Ramsar Convention Secretariat. https://www.global-wetland-outlook.ramsar.org
Hails, A. J. (Ed.). (1997). Wetlands, biodiversity and the Ramsar Convention. Ramsar
Convention Bureau. https://www.ramsar.org
Hess, L. L., Melack, J. M., Novo, E. M. L. M., Barbosa, C. C. F., & Gastil, M. (2003). Dual-
season mapping of wetland inundation and vegetation for the central Amazon basin. Remote Sensing of Environment, 87(4), 404-428. https://doi.org/10.1016/j.rse.2003.04.001
Houlahan, J. E., & Findlay, C. S. (2004). Estimating the 'critical' distance at which adjacent land-
use degrades wetland water and sediment quality. Landscape Ecology, 19(6), 677-690. https://doi.org/10.1023/B:LAND.0000042912.87067.e7
Laba, M., Blair, B., Downs, R., Monger, B., Philpot, W., Smith, S., Sullivan, P., & Baveye, P. C.
(2010). Use of textural measurements to map invasive wetland plants in the Hudson River National Estuarine Research Reserve with IKONOS satellite imagery. Remote Sensing of Environment, 114(4), 876-886. https://doi.org/10.1016/j.rse.2009.11.023
Mahdianpari, M., Salehi, B., Mohammadimanesh, F., & Motagh, M. (2017). Random forest
wetland classification using ALOS-2 L-band, RADARSAT-2 C-band, and TerraSAR-X imagery. ISPRS Journal of Photogrammetry and Remote Sensing, 130, 13-31. https://doi.org/10.1016/j.isprsjprs.2017.05.010
Mahdianpari, M., Salehi, B., Mohammadimanesh, F., Homayouni, S., & Gill, E. (2018). The
effect of PolSAR image segmentation on wetland classification. Canadian Journal of Remote Sensing, 44(5), 1-24. https://doi.org/10.1080/07038992.2018.1543363
Mahdianpari, M., Granger, J. E., Mohammadimanesh, F., Salehi, B., Brisco, B., Gill, E.,
Huberty, B., & Lang, M. (2019). Meta-analysis of wetland classification using remote sensing: A systematic review of a 40-year trend in North America. Remote Sensing of Environment, 232, 111382. https://doi.org/10.1016/j.rse.2019.111382
Mayer, P. M., Reynolds, S. K., McCutchen, M. D., & Canfield, T. J. (2007). Meta-analysis of
nitrogen removal in riparian buffers. Journal of Environmental Quality, 36(4), 1172-1180. https://doi.org/10.2134/jeq2006.0462
Mitsch, W. J., & Gosselink, J. G. (2023). Wetlands (6th ed.). Wiley
National Wetlands Working Group. (1997). The Canadian wetland classification system (2nd
ed., B. G. Warner & C. D. A. Rubec, Eds.). Wetlands Research Centre, University of Waterloo. http://www.wetlandpolicy.ca/canadian-wetland-classification-system
Ramsar Convention. (2024). Scaling up wetland conservation: Guidance on including wetlands
in NBSAPs. https://www.ramsar.org/sites/default/files/2024-08/TR-NBSAPs.pdf
Ramsar Convention Secretariat. (2002). Resolution VIII.6: A Ramsar framework for wetland
inventory. Ramsar Convention on Wetlands. https://www.millenniumassessment.org/res/key_res_viii_06_e.pdf
Ramsar Convention Secretariat. (2002). Resolution VIII.14: New guidelines for management
planning for Ramsar sites and other wetlands. https://www.ramsar.org/sites/default/files/documents/pdf/res/key_res_viii_14_e.pdf
Ramsar Convention Secretariat. (2005). Resolution IX.1 Annex A: A conceptual framework for
the wise use of wetlands and the maintenance of their ecological character. https://www.ciesin.columbia.edu/repository/entri/docs/cop/Ramsar_COP09_001A.pdf
Ramsar Convention Secretariat. (2007). The Ramsar concept of 'wise use' (Ramsar Technical
Report No. 1). Ramsar Convention on Wetlands. https://www.ramsar.org/sites/default/files/documents/library/info2007-07-e.pdf
Ramsar Convention Secretariat. (2020). A new toolkit for national wetlands inventories. Ramsar
Convention on Wetlands. https://medwet.org/en/publications/a-new-toolkit-for-national-wetlands-inventories/
Smith, R. D., Ammann, A., Bartoldus, C., & Brinson, M. M. (1995). An approach for assessing
wetland functions using hydrogeomorphic classification, reference wetlands, and functional indices (Technical Report WRP-DE-9). U.S. Army Corps of Engineers. https://emrrp.el.erdc.dren.mil/elpubs/pdf/wrpde9.pdf
Tamiminia, H., Salehi, B., Mahdianpari, M., & Bhatt, U. (2022). Decision tree-based machine
learning models for above-ground biomass estimation using multi-source remote sensing data. Remote Sensing, 14(6), 1413. https://doi.org/10.3390/rs14061413
Tiner, R. W., Lang, M. W., & Klemas, V. V. (Eds.). (2015). Remote sensing of wetlands:
Applications and advances. CRC Press. https://doi.org/10.1201/b18210
Tsyganskaya, V., Martinis, S., Marzahn, P., & Ludwig, R. (2018). Detection of temporary
flooded vegetation using Sentinel-1 time series data. Remote Sensing, 10(8), 1286. https://doi.org/10.3390/rs10081286
U.S. Army Corps of Engineers, Sacramento District. (2005). Wetland buffers: Use and
effectiveness. U.S. Army Corps of Engineers. https://www.spk.usace.army.mil/Portals/12/documents/regulatory/pdf/Wetland_Buffers_Use_and_Effectiveness.pdf
U.S. Fish and Wildlife Service. (2024). National Wetlands Inventory program. U.S. Department
of the Interior. https://www.fws.gov/program/national-wetlands-inventory
Whiteside, T. G., & Franklin, D. C. (2017). Remote sensing of wetland types in tropical
Australia. Wetlands Ecology and Management, 25(3), 295-313. https://doi.org/10.1007/s11273-016-9497-y
Zhou, Y., Dong, J., Xiao, X., Liu, R., Zou, Z., Zhao, G., Ge, Q. (2023). GWL_FCS30: A global
30m wetland map with a fine classification system using multi-sourced and time-series remote sensing imagery. Earth System Science Data, 15(1), 265-293. https://essd.copernicus.org/articles/15/265/2023/